Woking 3D Model
Reduce uncertainty with our Woking 3D Model. Tap into comprehensive data layers to minimise planning risks, anticipate potential impacts, and speed up critical decisions.
With VU.CITY’s precise and immersive Woking digital twin platform, teams collaborate effortlessly, driving smarter outcomes and boosting planning success.

Woking data layers for contextual viability
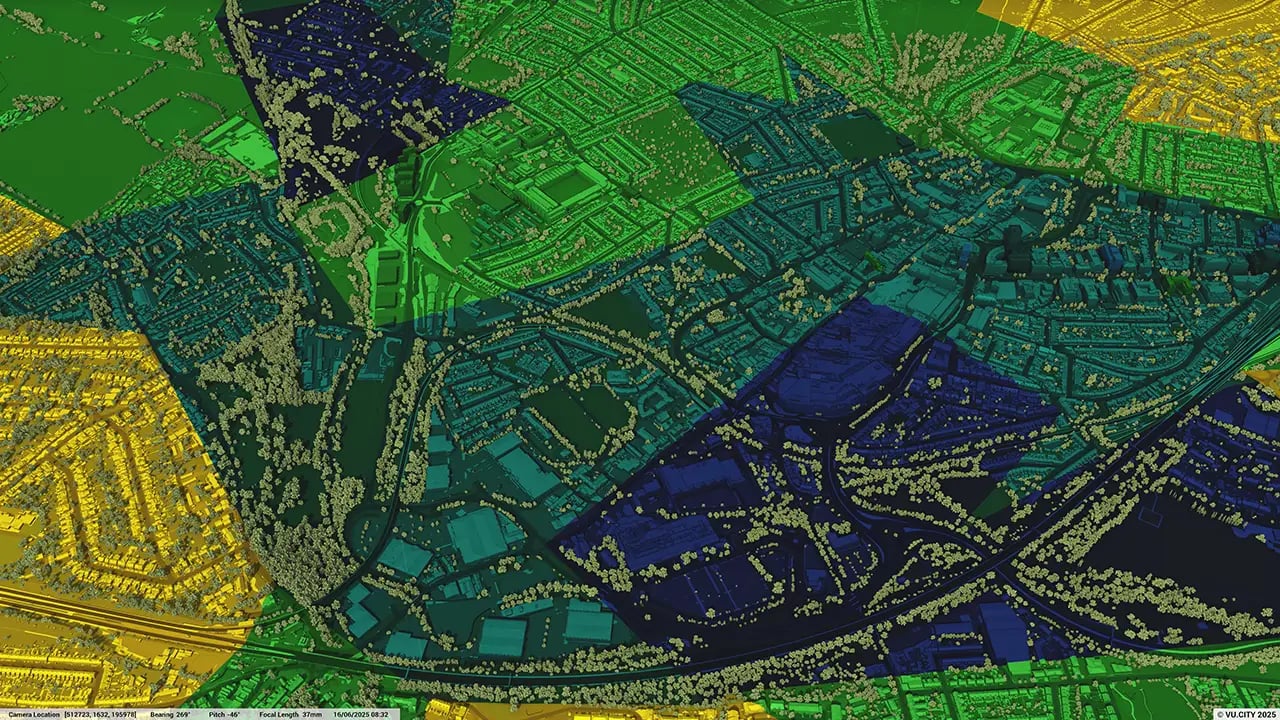
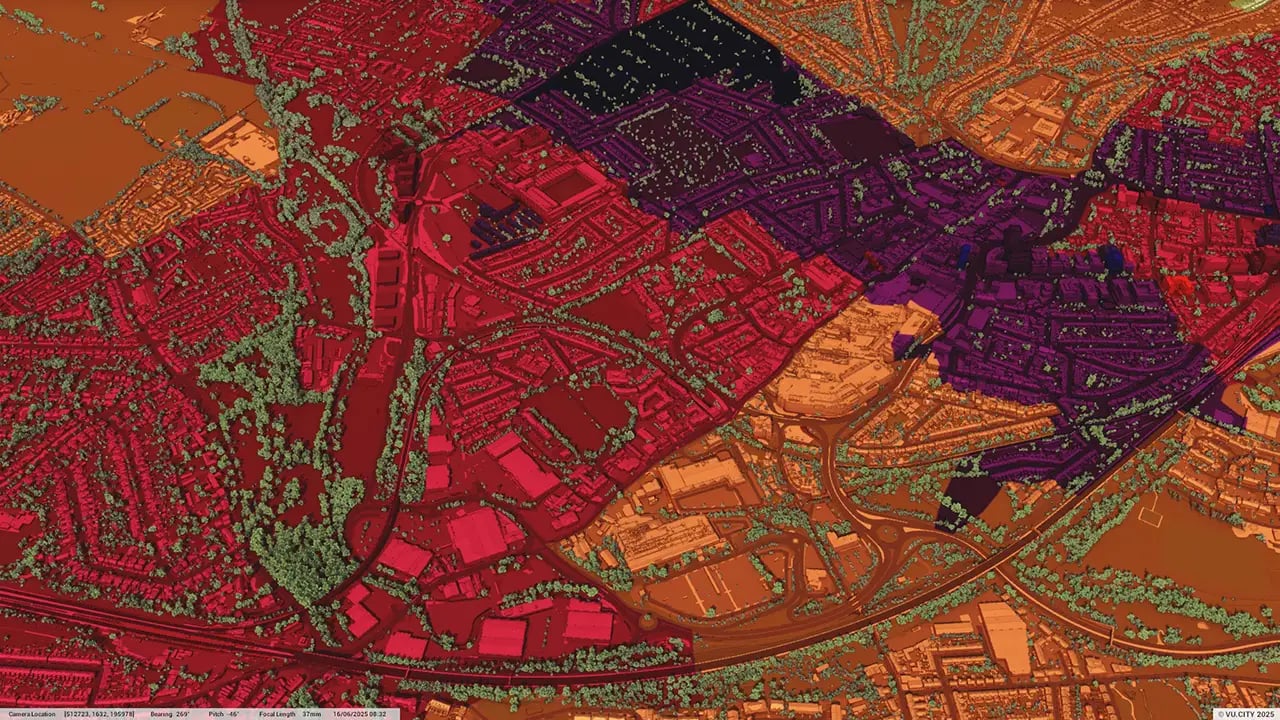
From transportation and zoning to environmental factors, VU.CITY Woking 3D model data layers provide essential insights for more informed and confident decision-making.
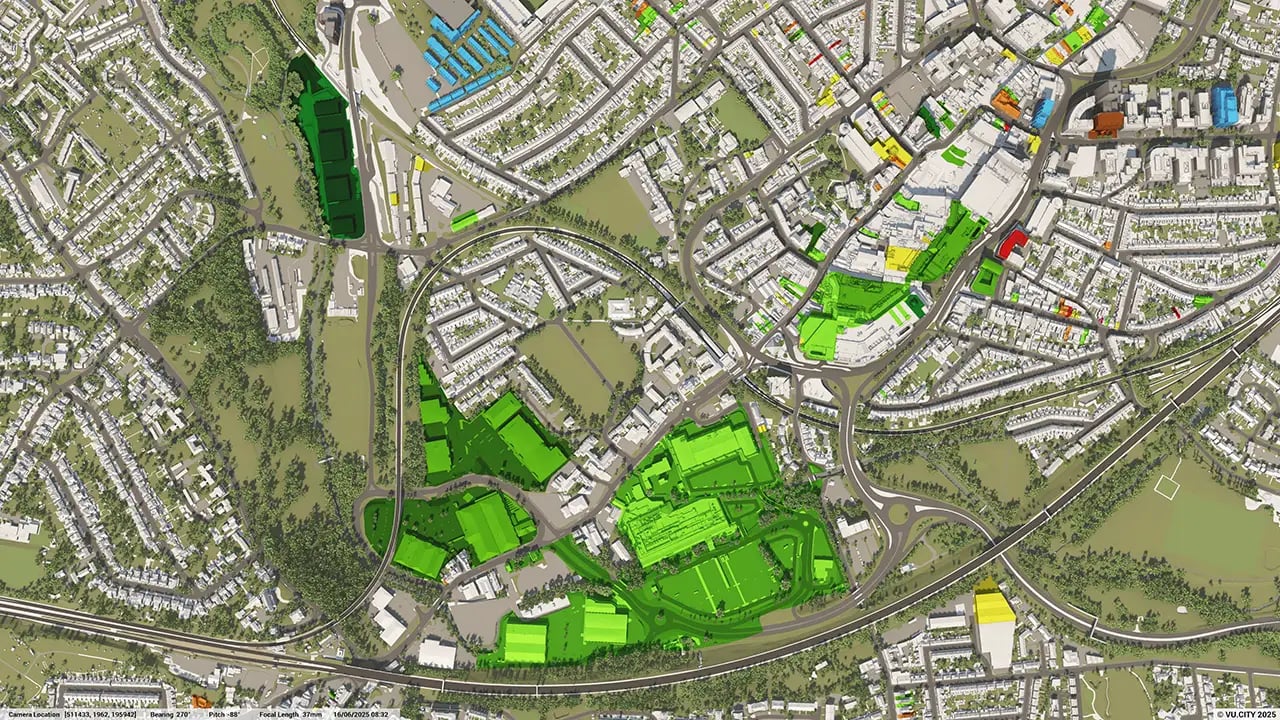
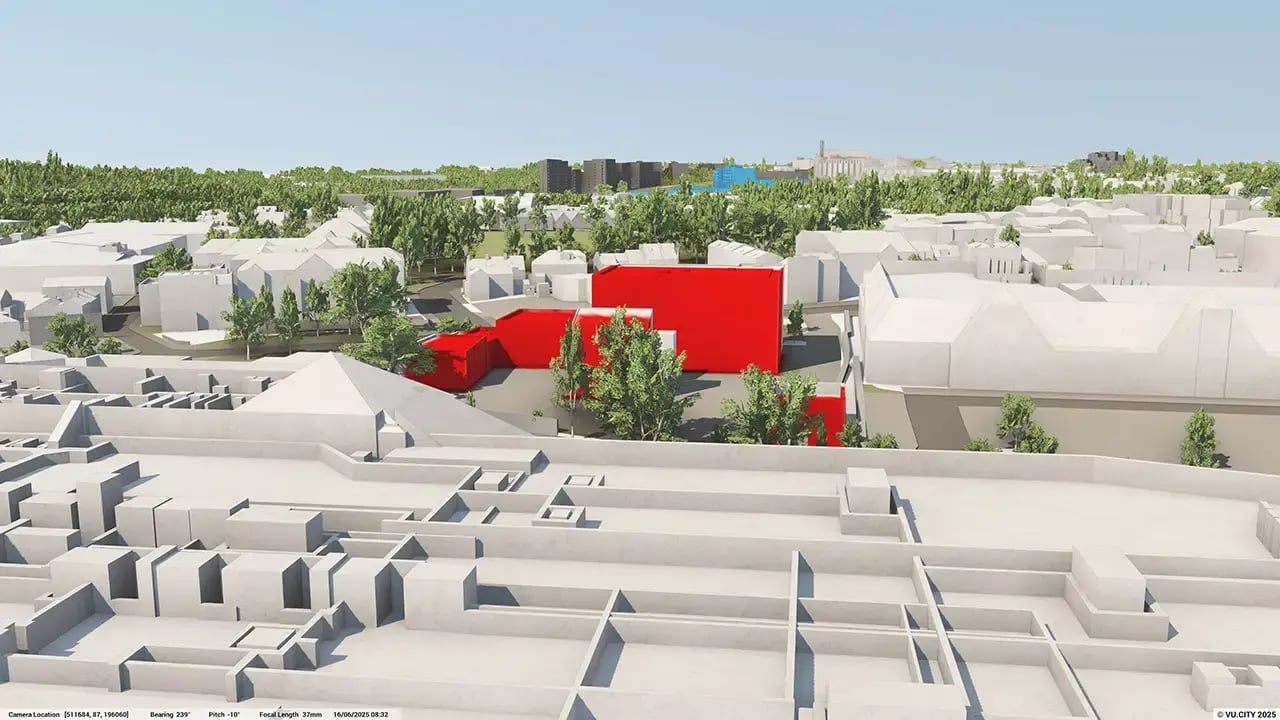
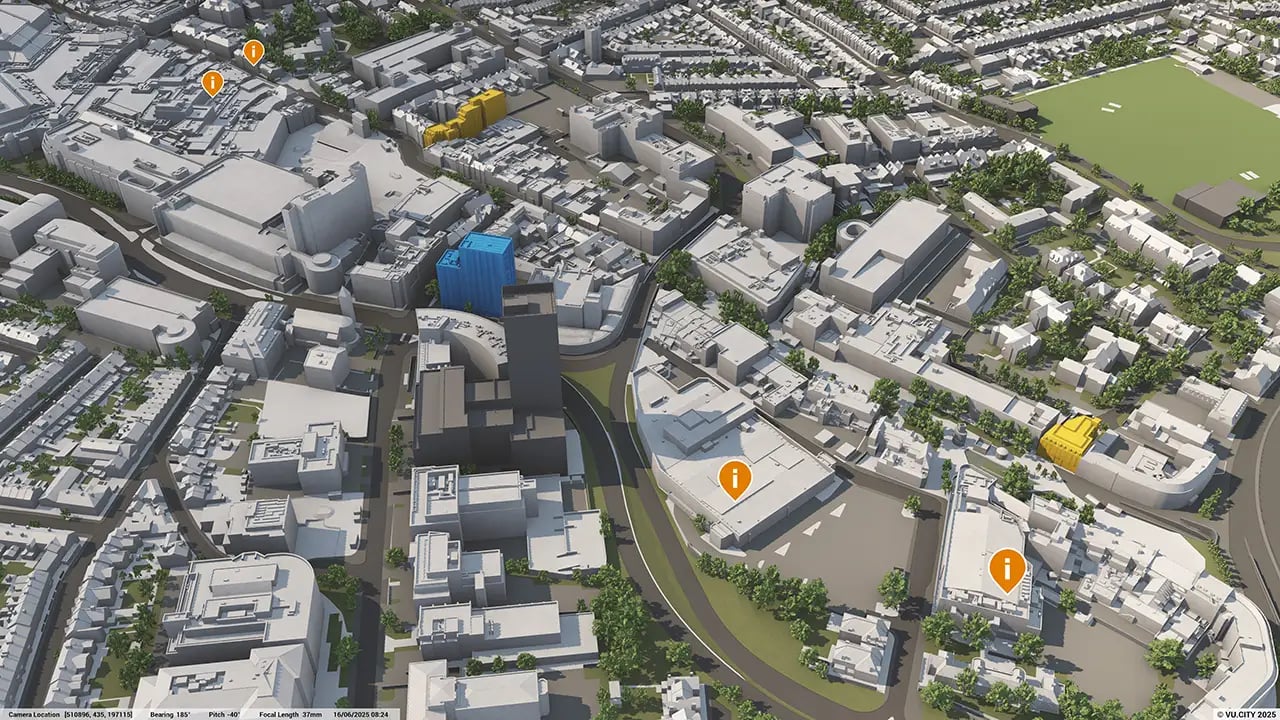

Woking is a modern town undergoing major regeneration projects, and was named by The Times as one of the UK’s top towns to live in as it offers “the best of both worlds", being rural but not remote.
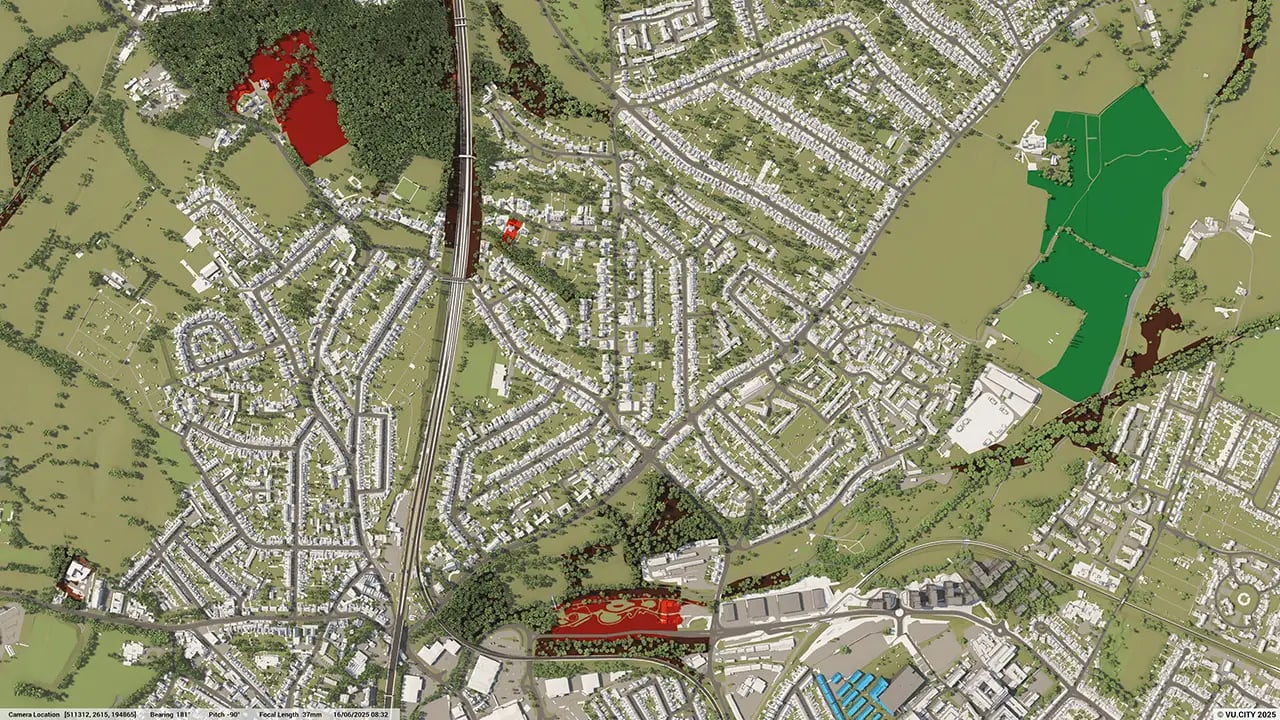
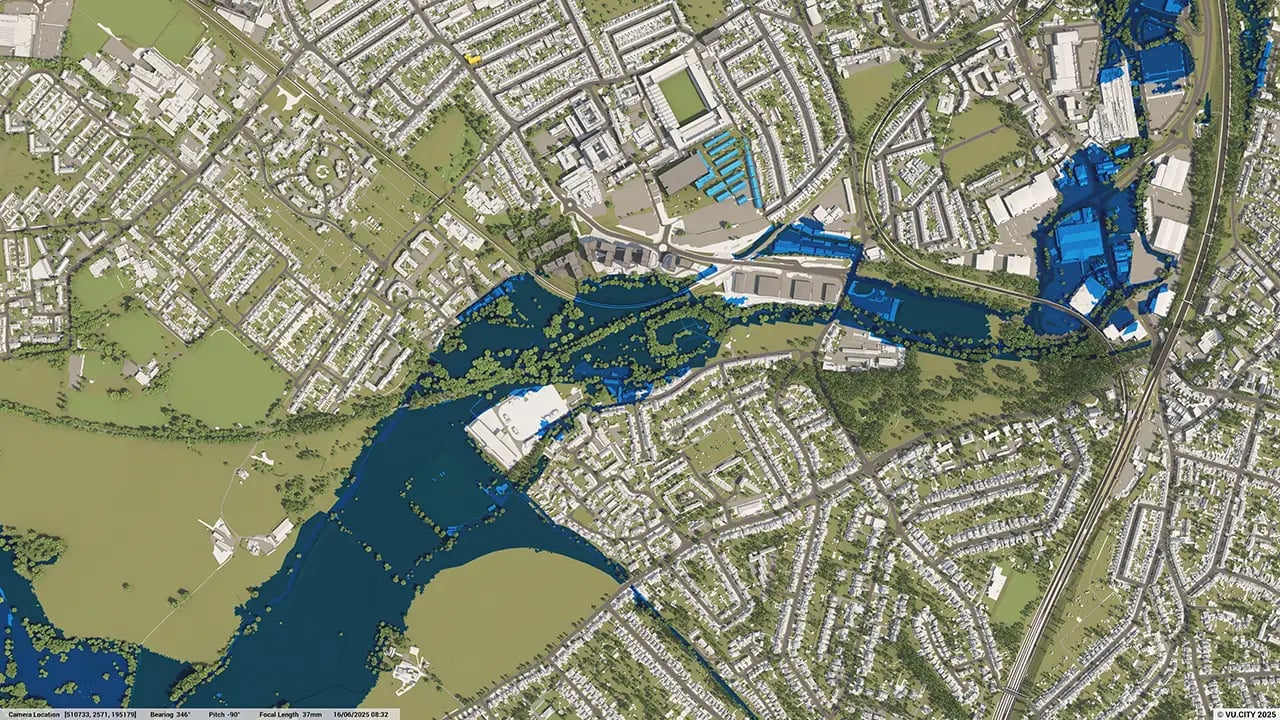
Redevelopment of the town centre over the last 50 years has resulted in the demolition of much of the original Victorian town centre, and there is still a need for better and greener public spaces. Most new development has to be directed to previously developed land in the town, with consideration needed to environmental designations, and areas liable to flood.
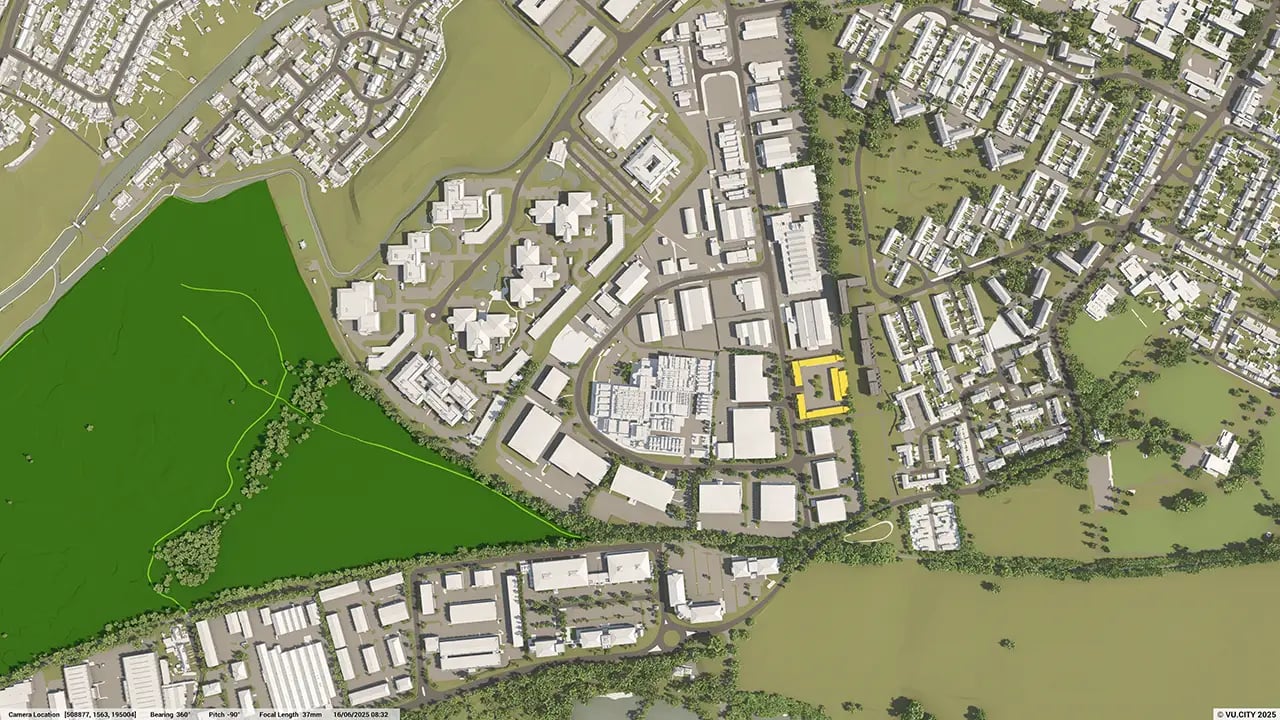
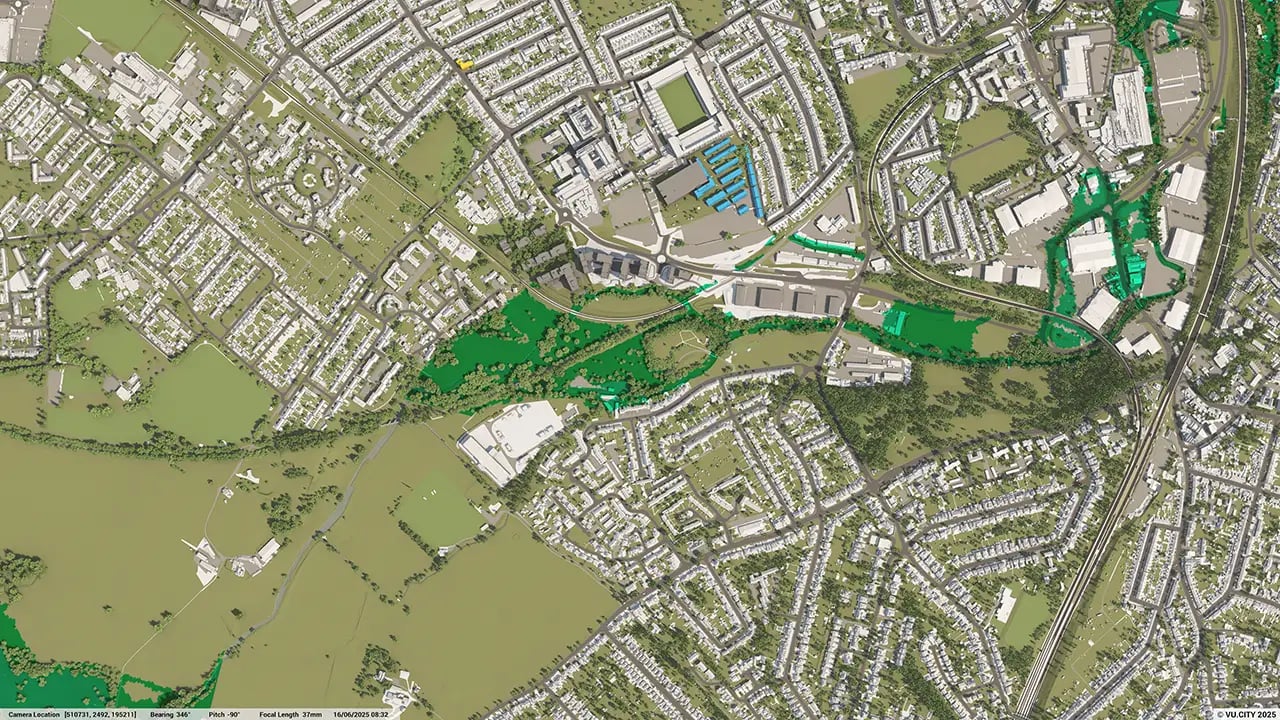
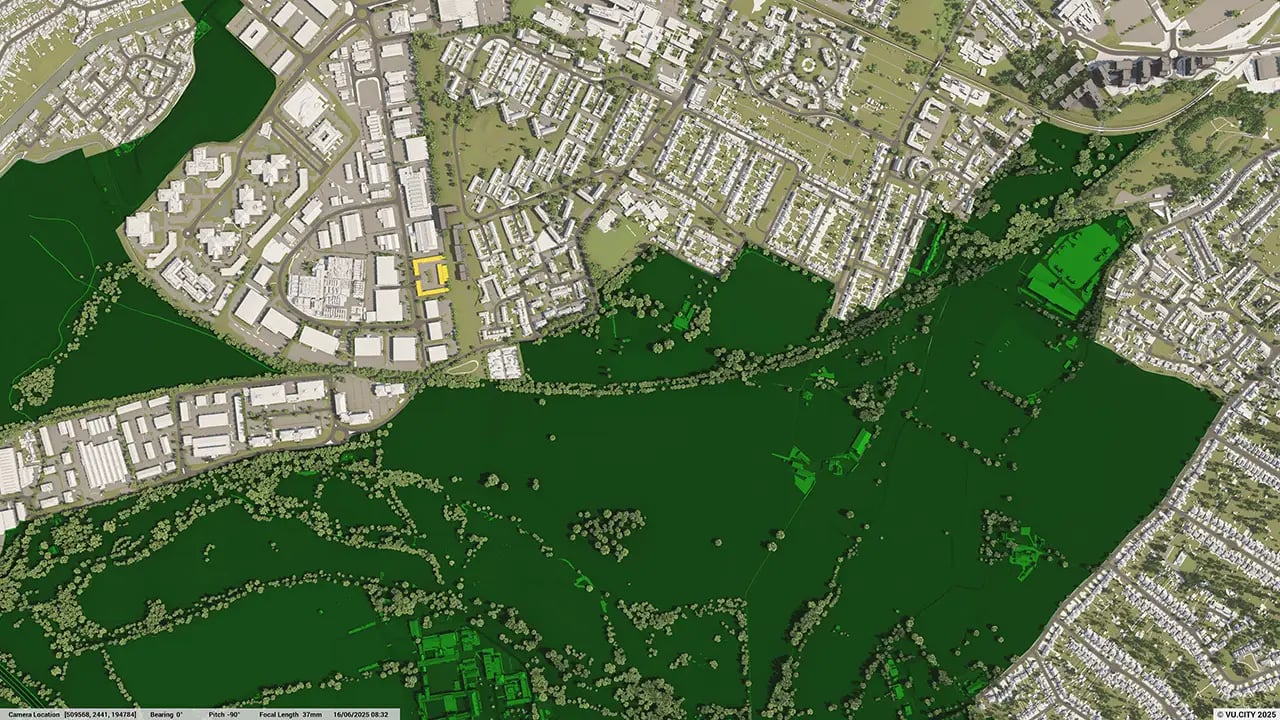
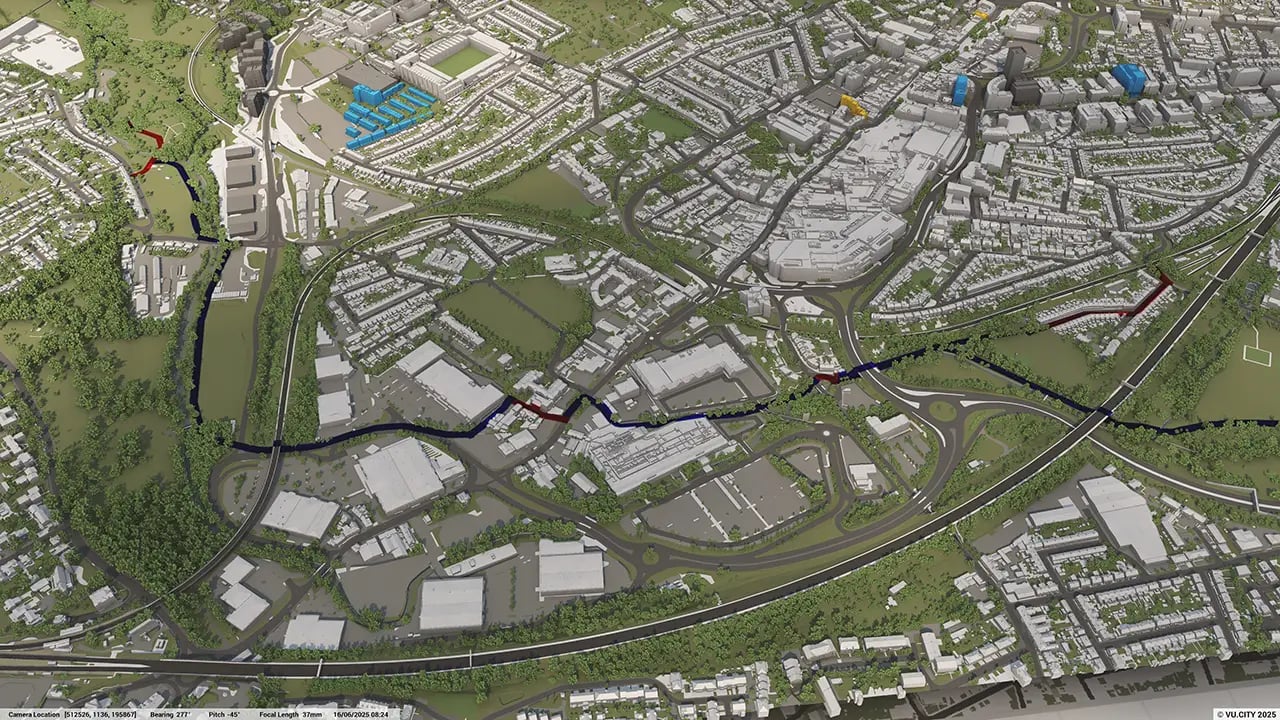
Outside of the main urban areas, the remaining 60% of the borough is green belt, including Goldsworth Park Lake and Horsell Common and with a 33 mile stretch of the Basingstoke Canal running through the borough.
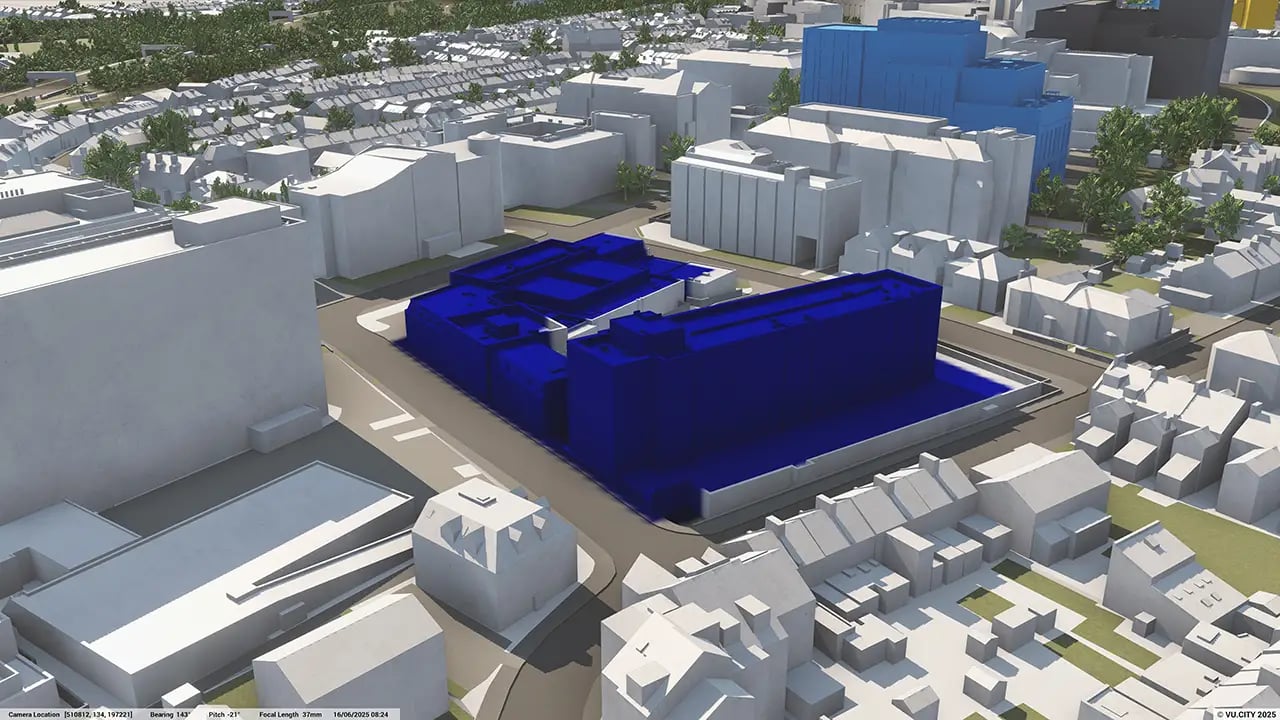
Users of VU.CITY Woking, including Woking Borough Council and Hawkins\Brown, have already discovered the model’s many benefits. From being able to understand and assess a site’s opportunities and challenges, testing refined designs in context, enhancing pre-app conversations and planning submissions, to improving how everyone involved collaborates.
Trusted by 6,000+ users across 26 cities
Architects, developers, local authorities, urban planners, and more trust VU.CITY to help achieve their goals.
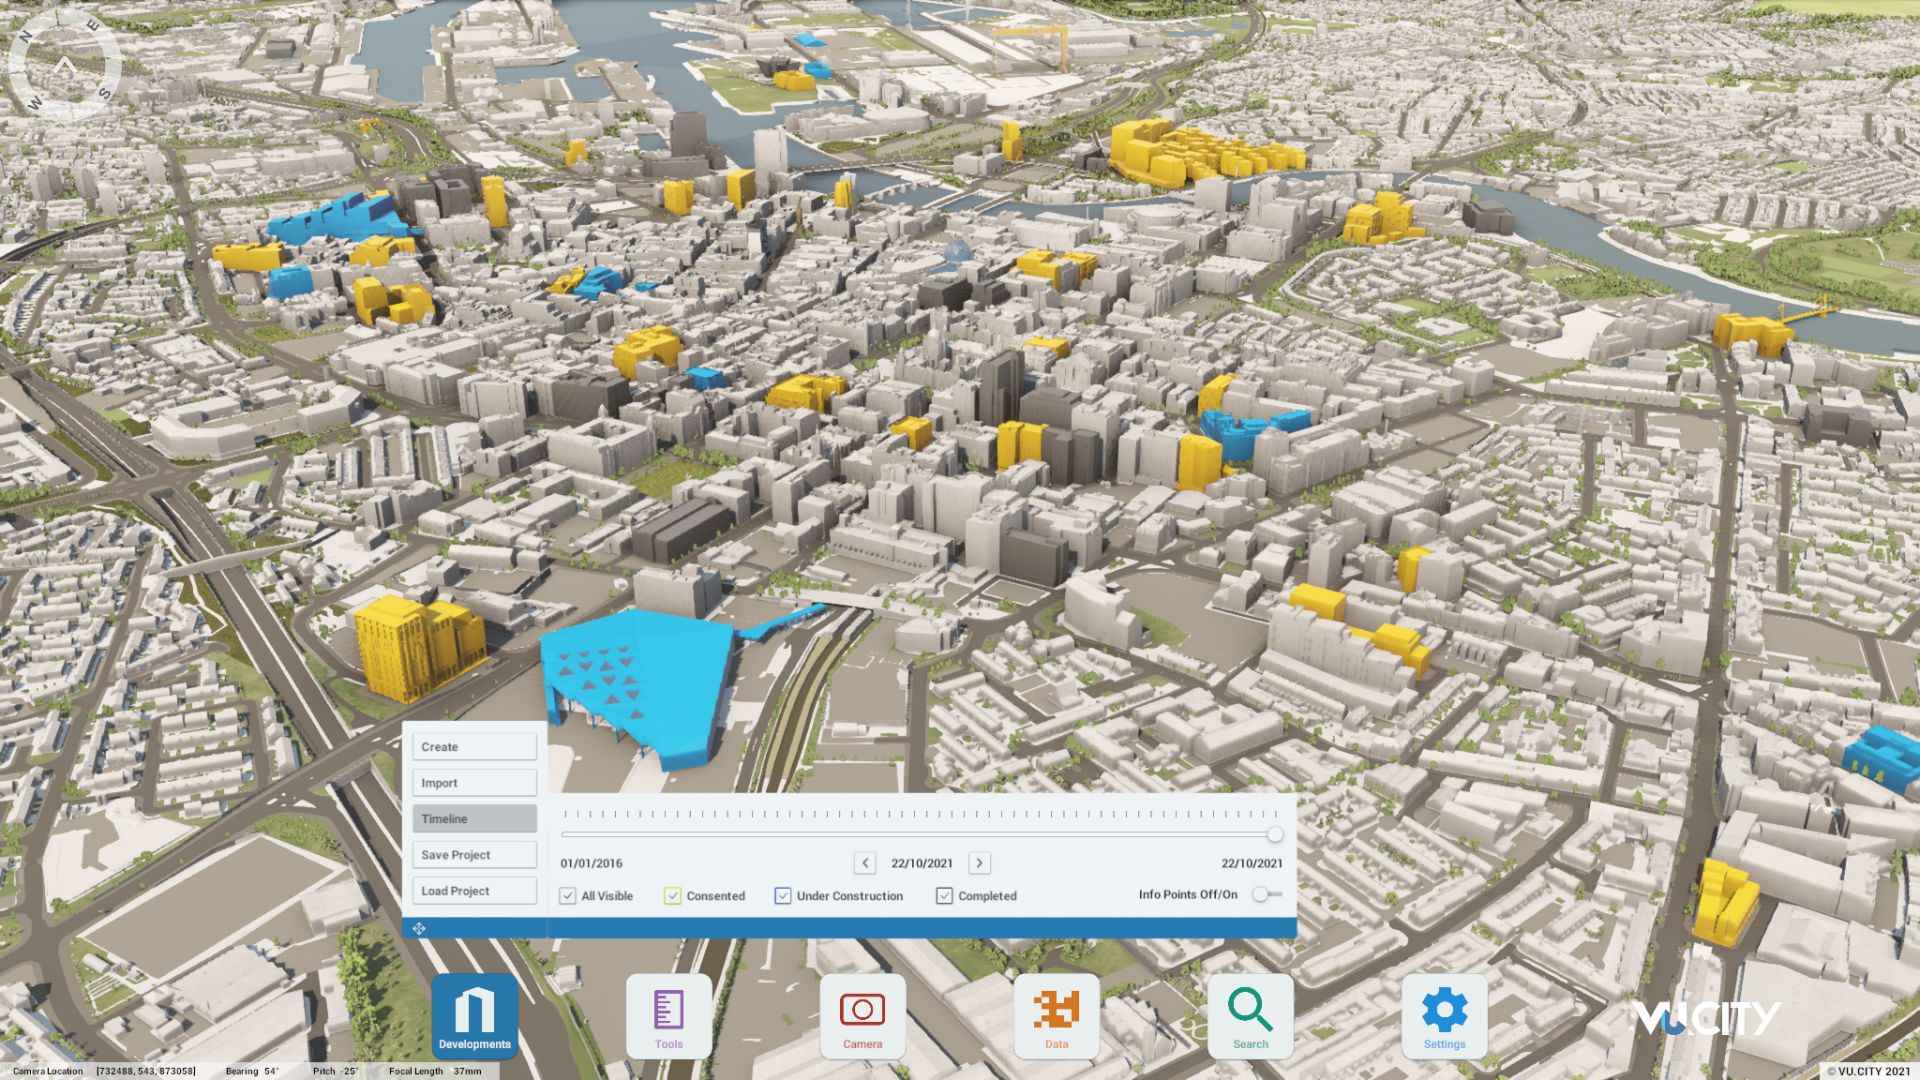
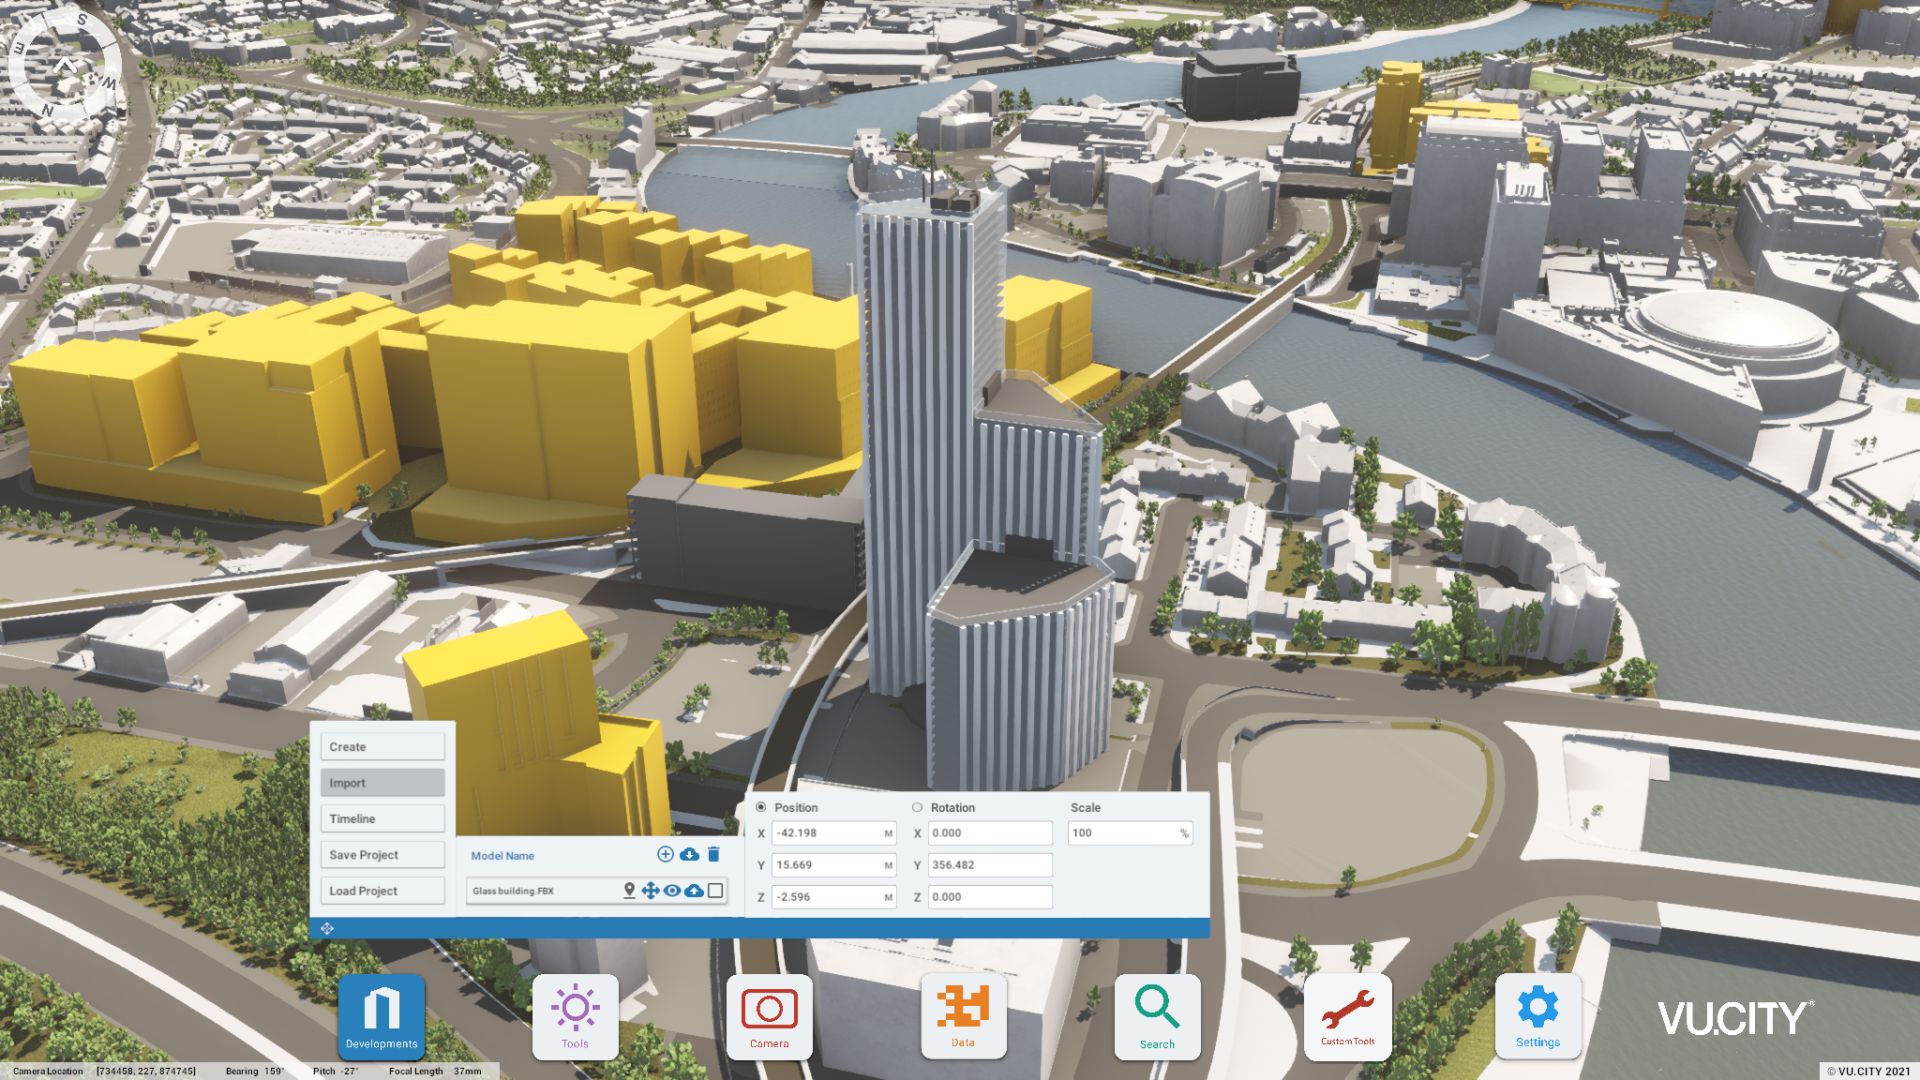
Organise and visualise your geospatial data in accurate context with our comprehensive suite of digital design and development tools.
VU.CITY Woking: 3D Model Features and Planning Tools
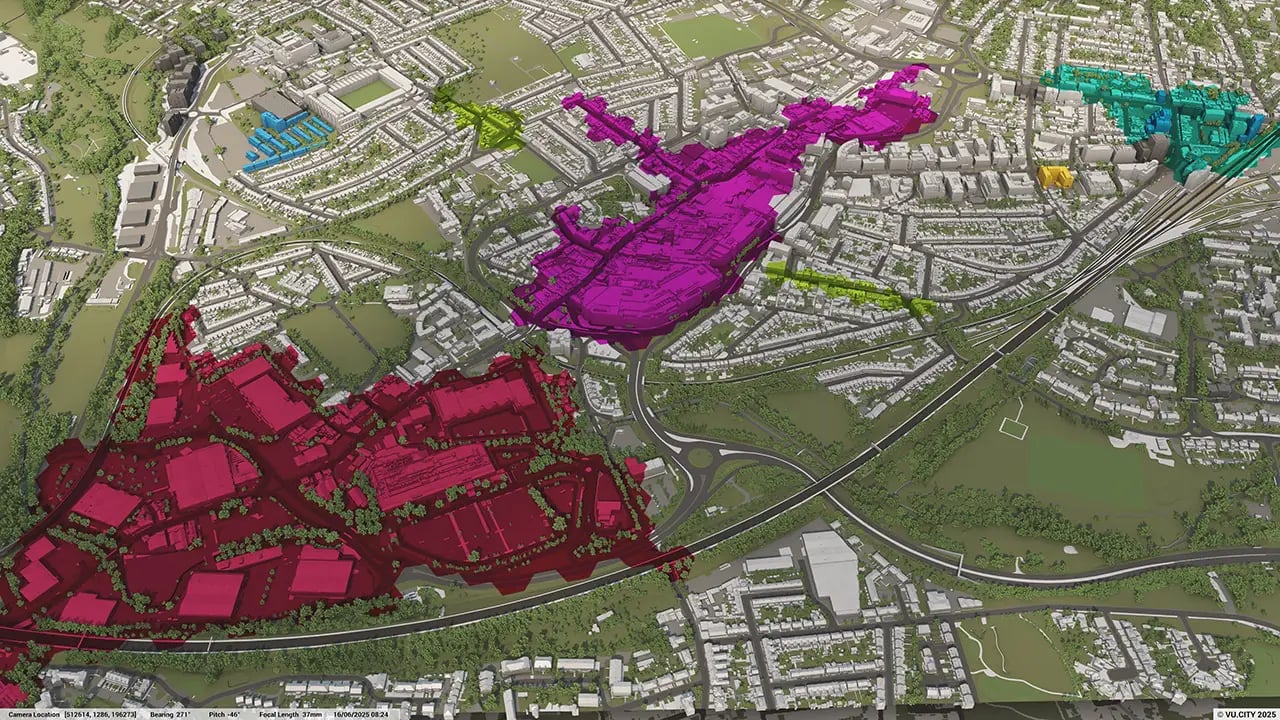
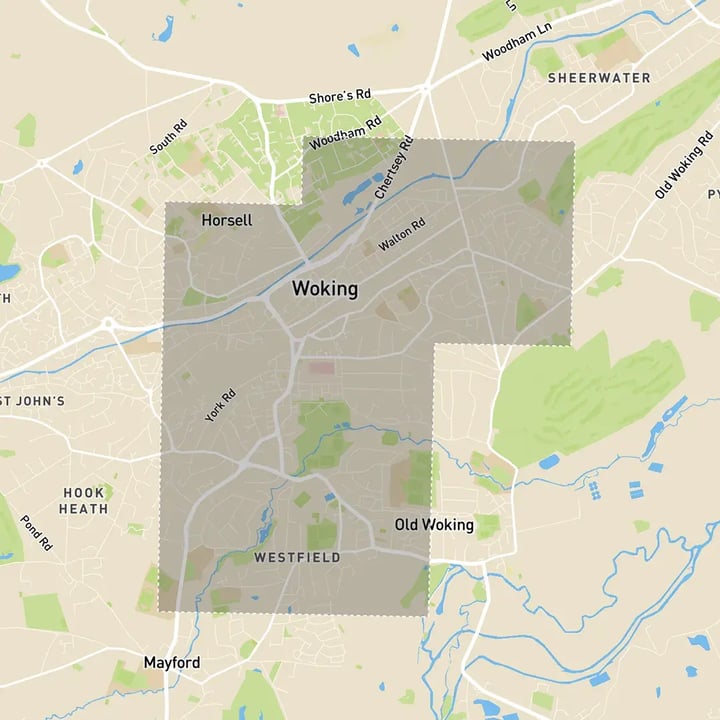
Woking 3D tile coverage
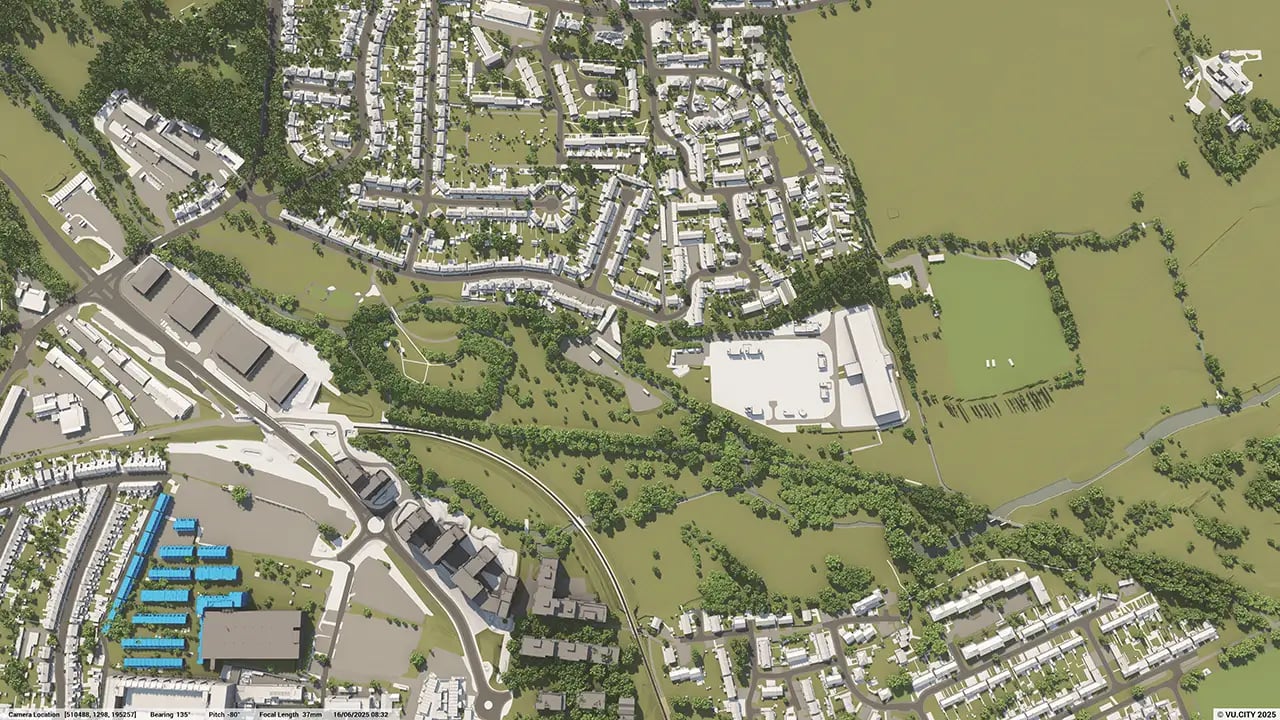
Whether you’re focusing on a single neighbourhood or the entire cityscape, VU.CITY provides full coverage with unmatched precision.
VU.CITY Woking FAQs
Here are some frequently asked questions about VU.CITY's Woking 3D Digital Twin and Model.
How can the VU.CITY Woking model support sustainable redevelopment in a growing town?
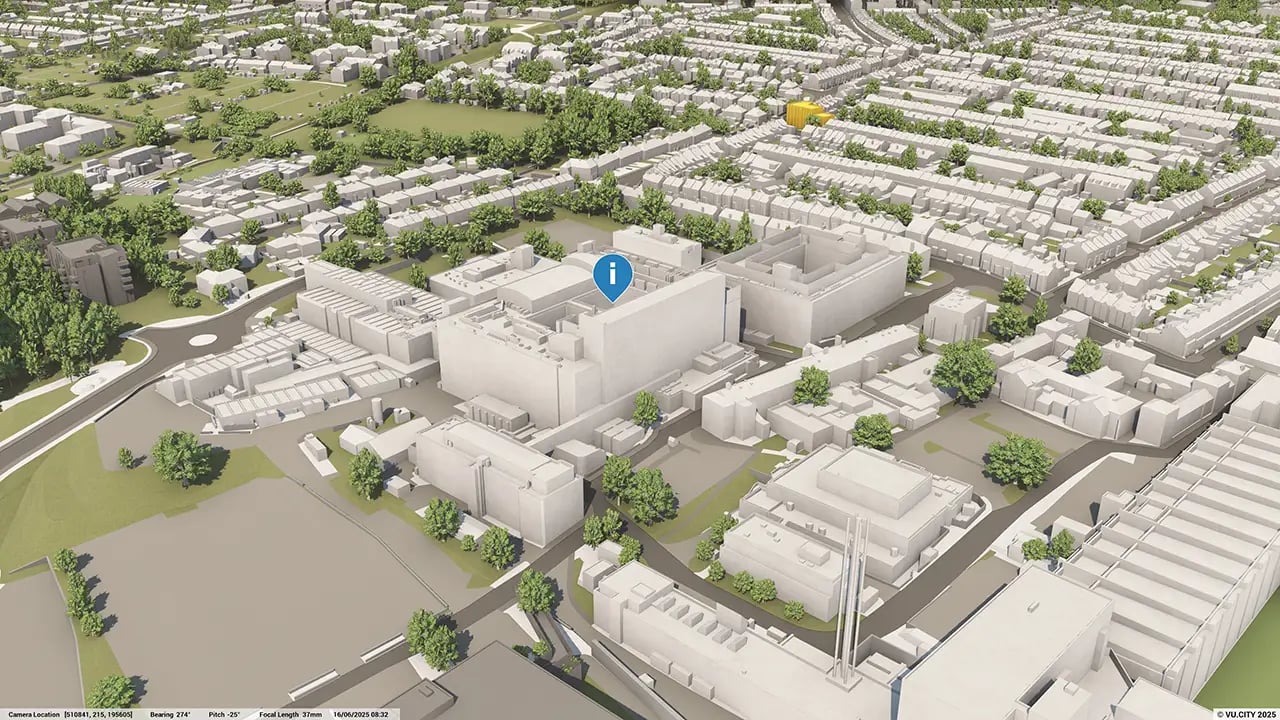
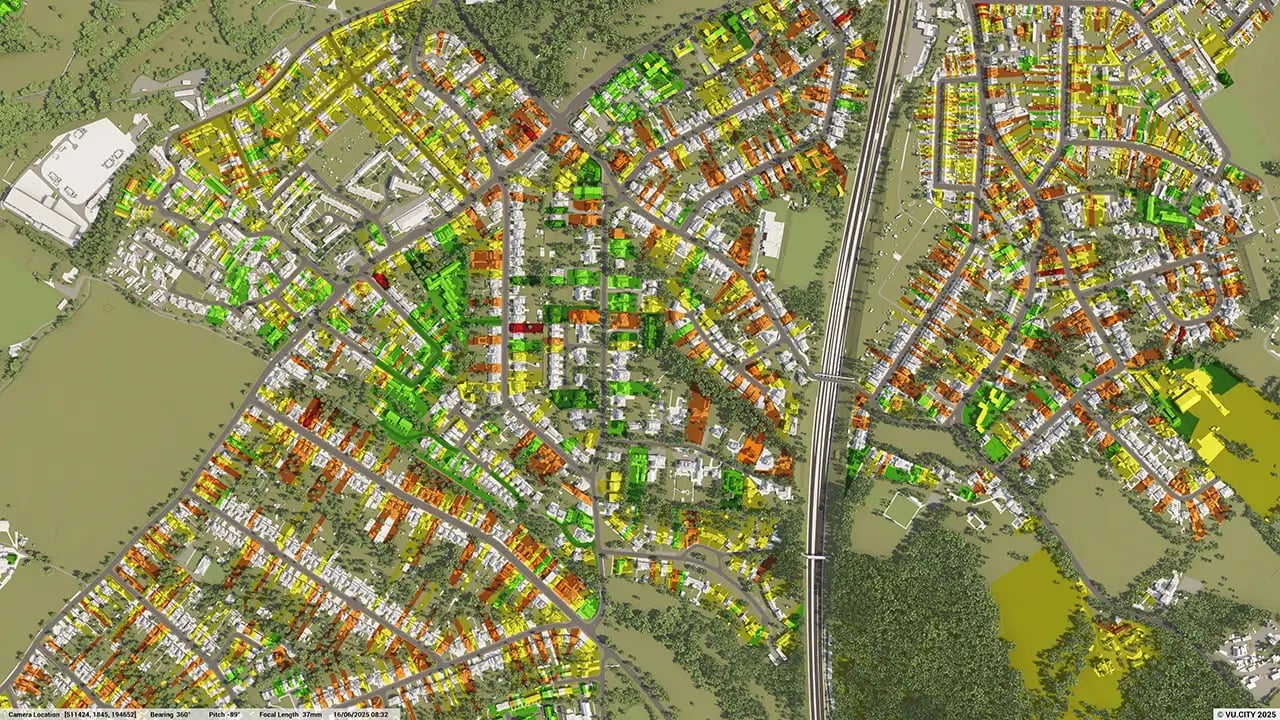
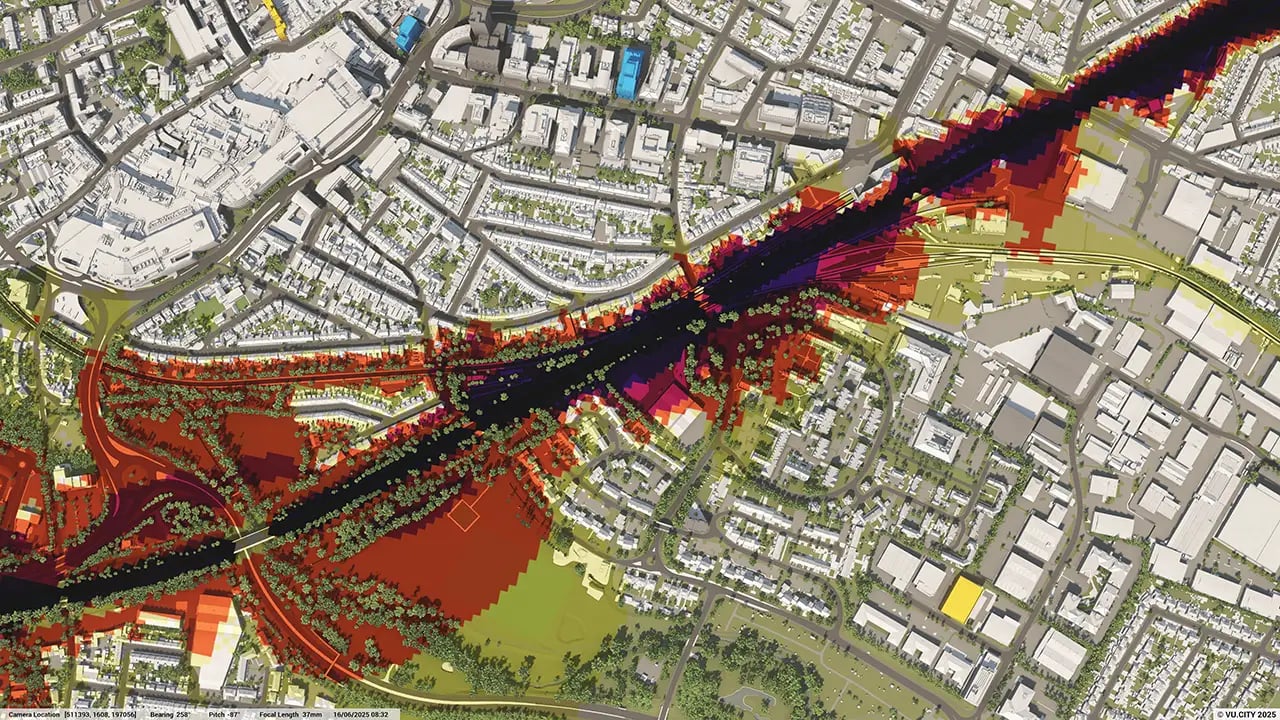
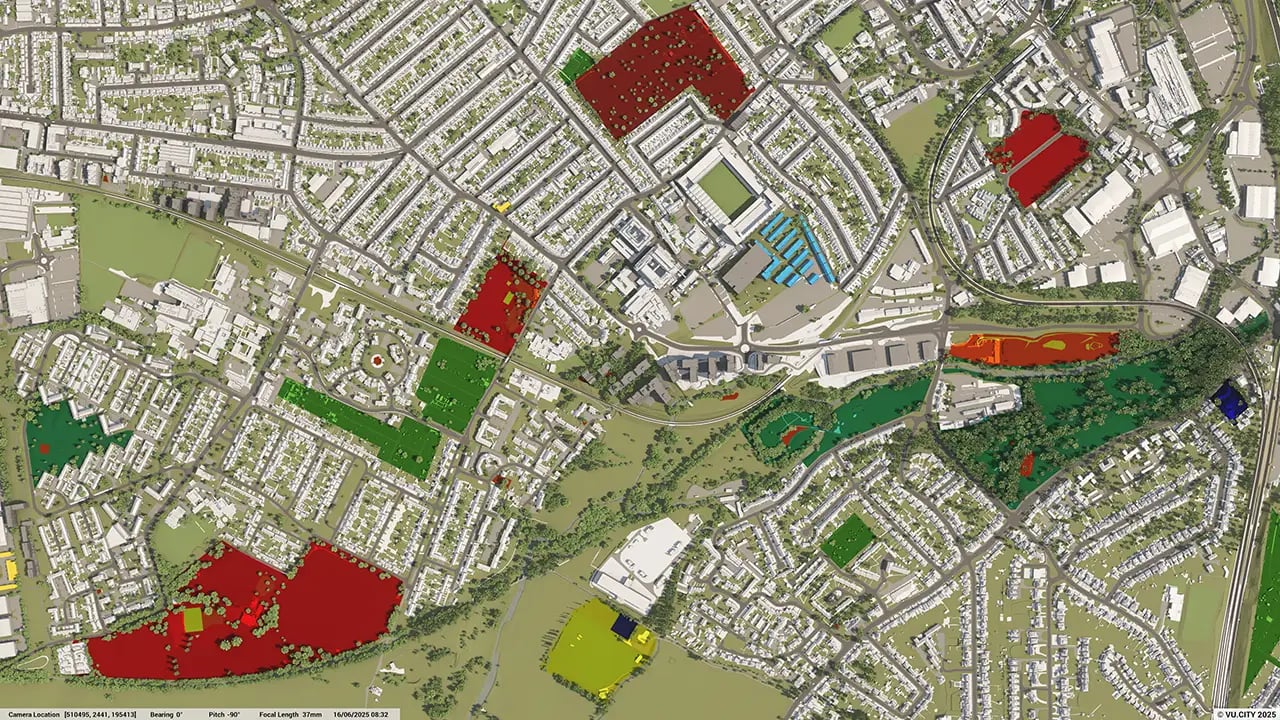
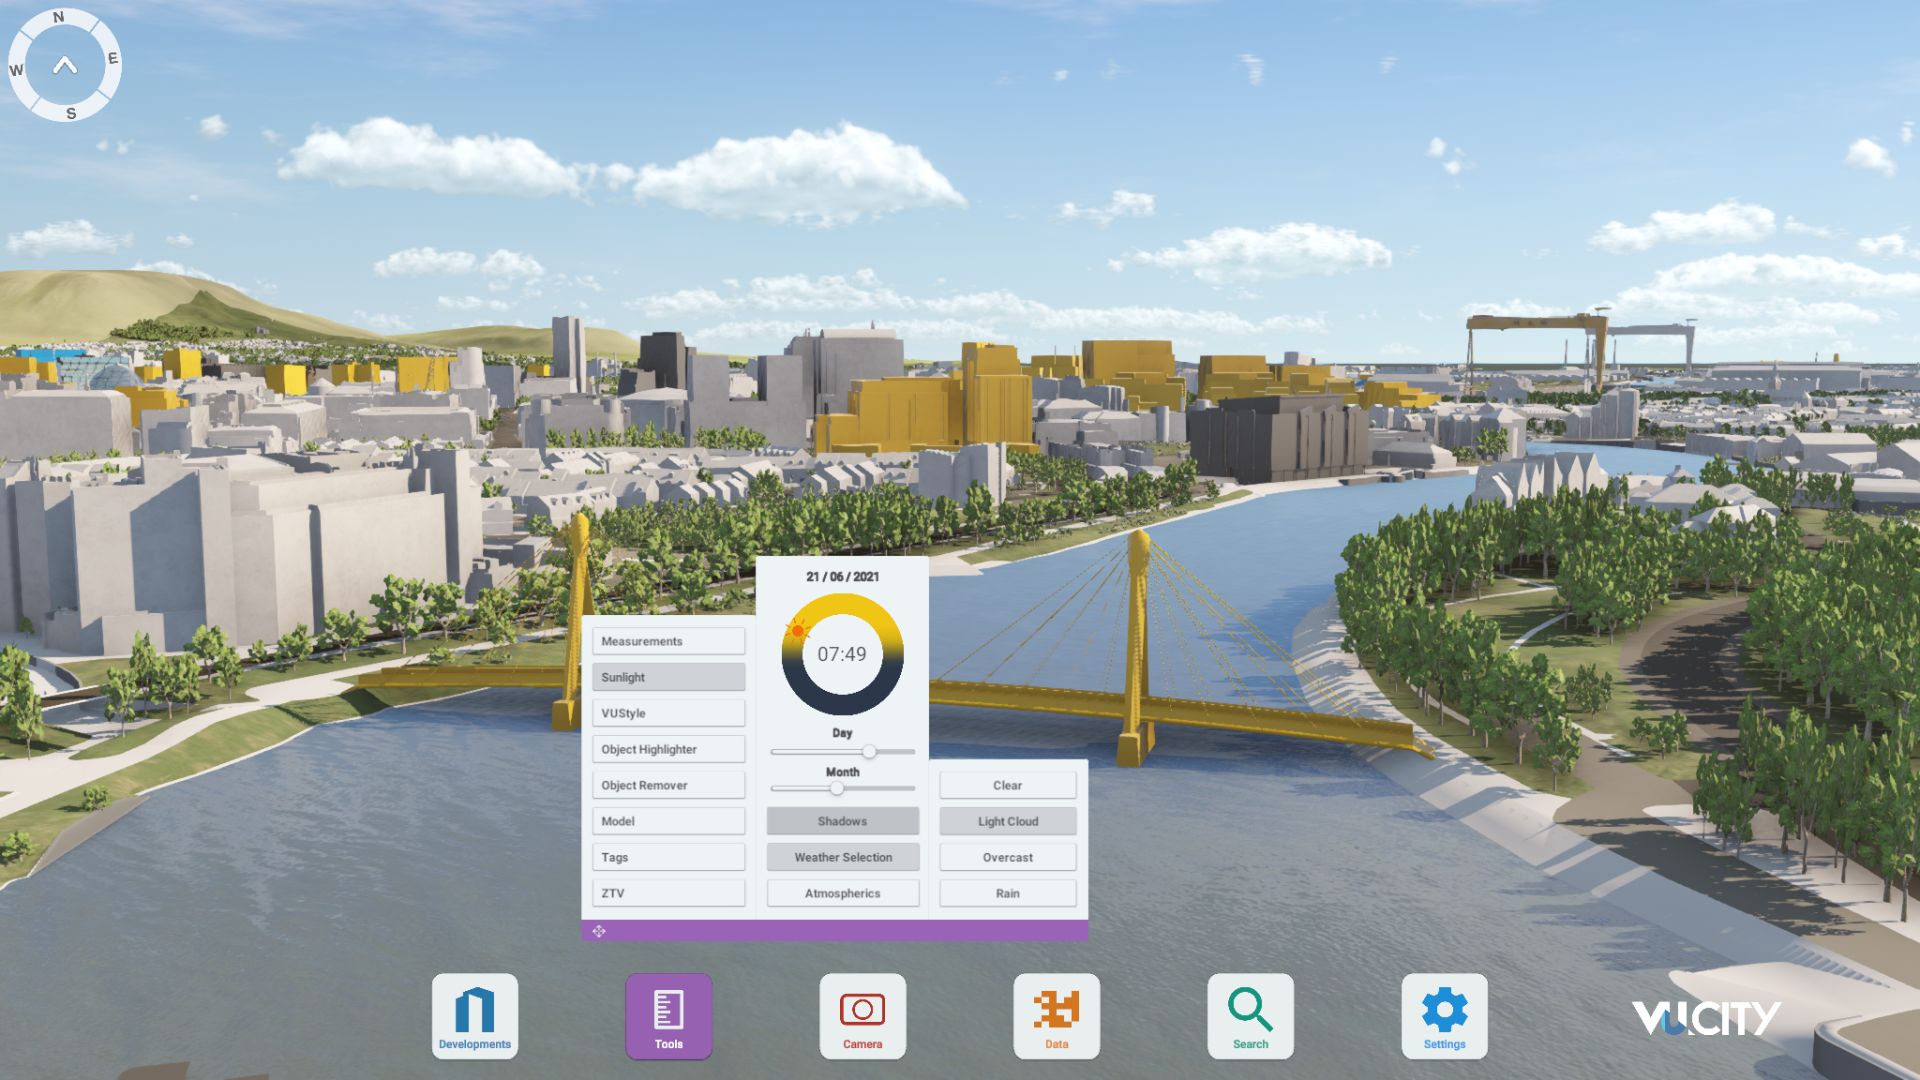
The model allows users to visualise projects within Woking’s evolving town centre, helping planners and developers assess designs with sustainability in mind. Features like sunlight analysis and green space data aid in creating environmentally responsible developments.
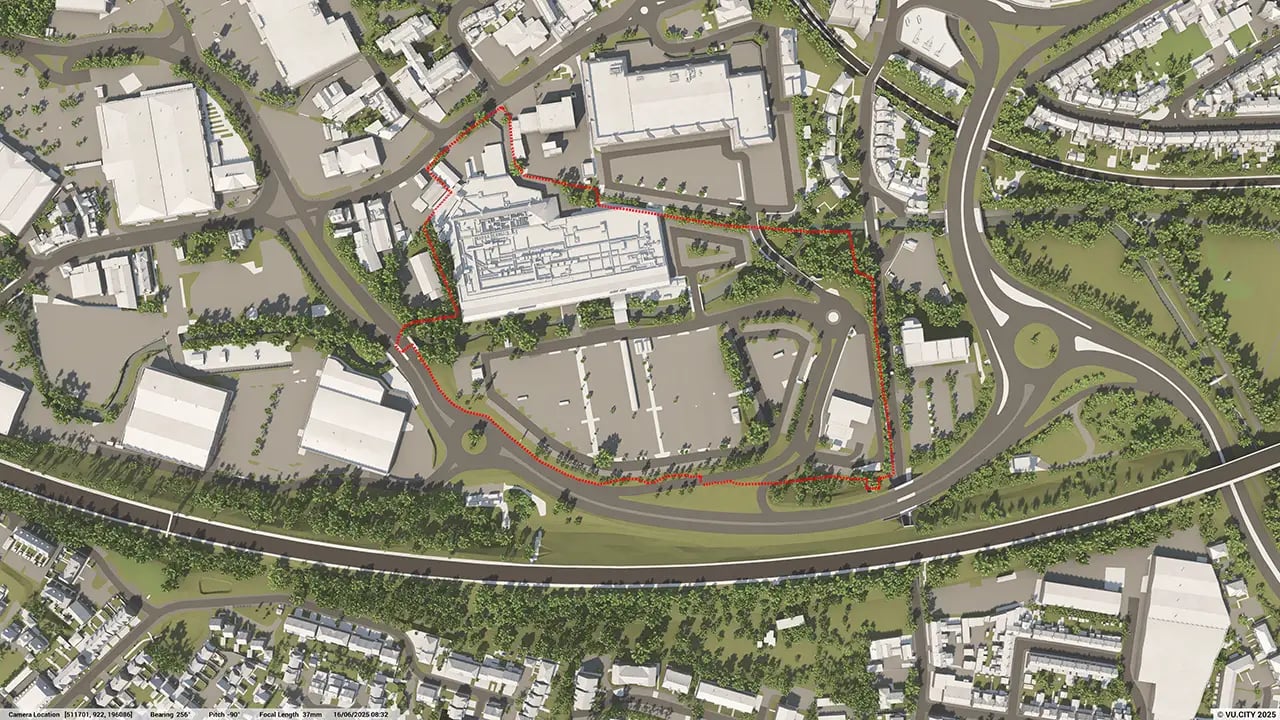
What tools are available for assessing design options in the Woking model?
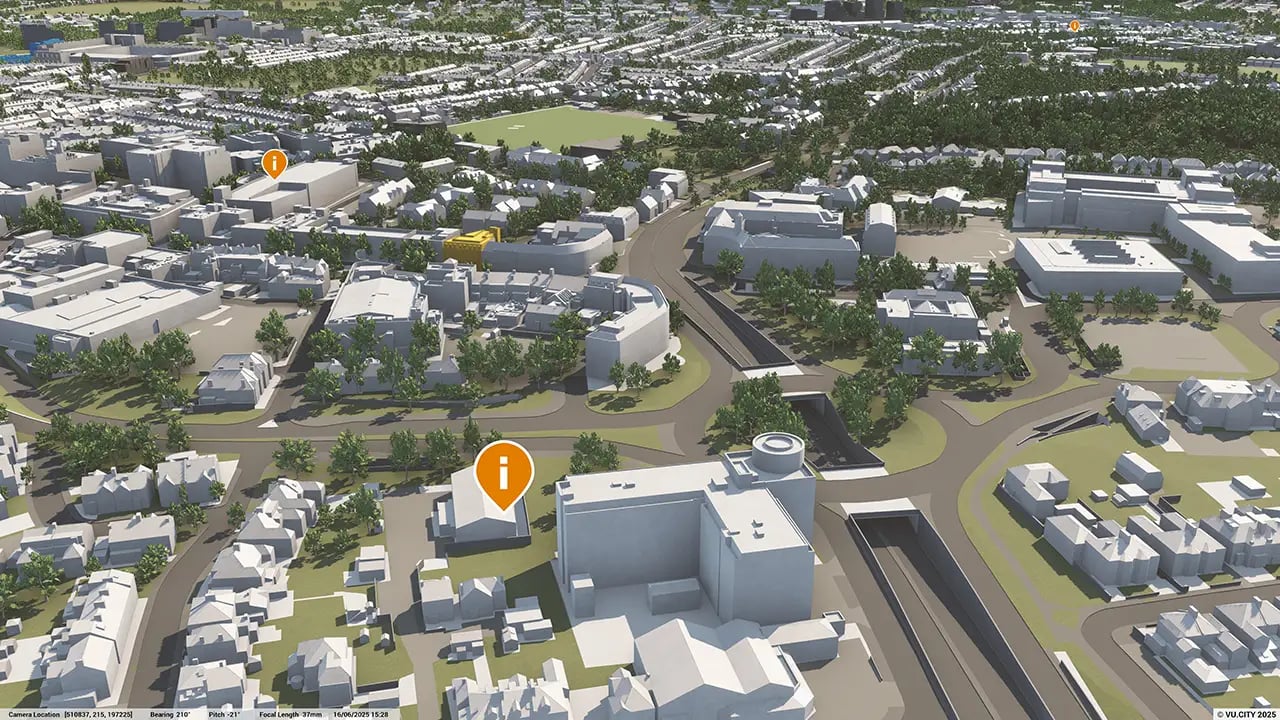
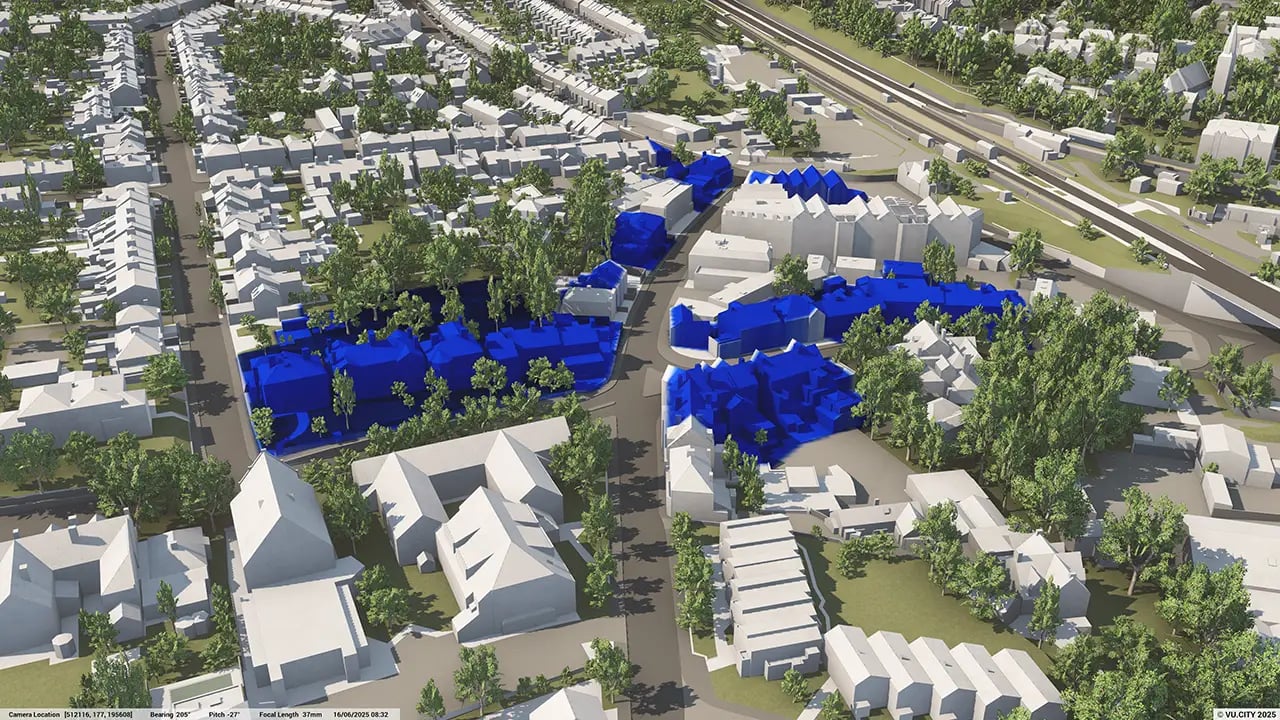
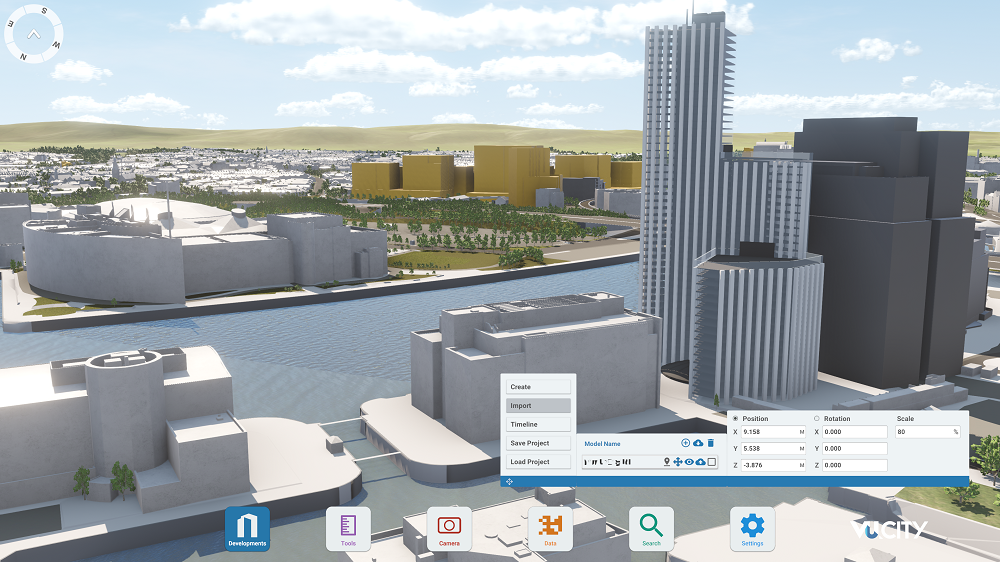
The Woking model includes tools for testing massing options, assessing General Employment Area (GEA) potential, and viewing recently consented schemes. These tools help users refine designs early, ensuring they align with Woking’s urban renewal goals.
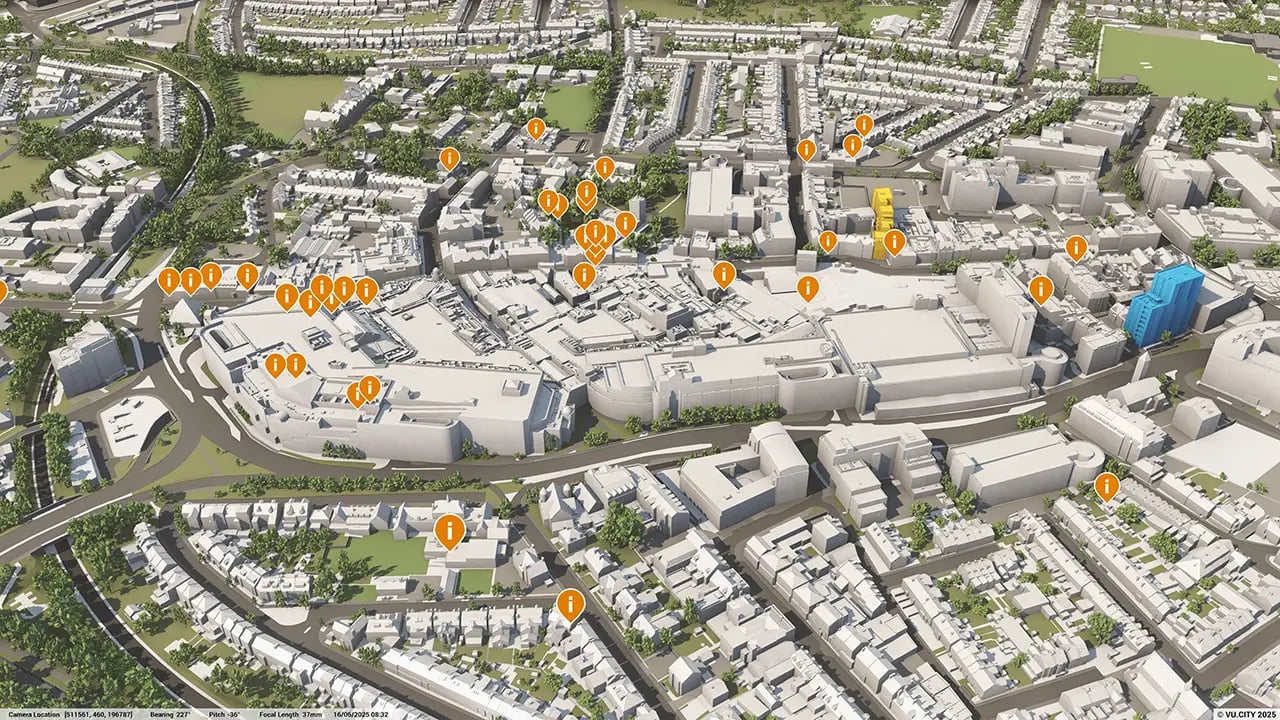
How can the VU.CITY Woking model improve communication with stakeholders?
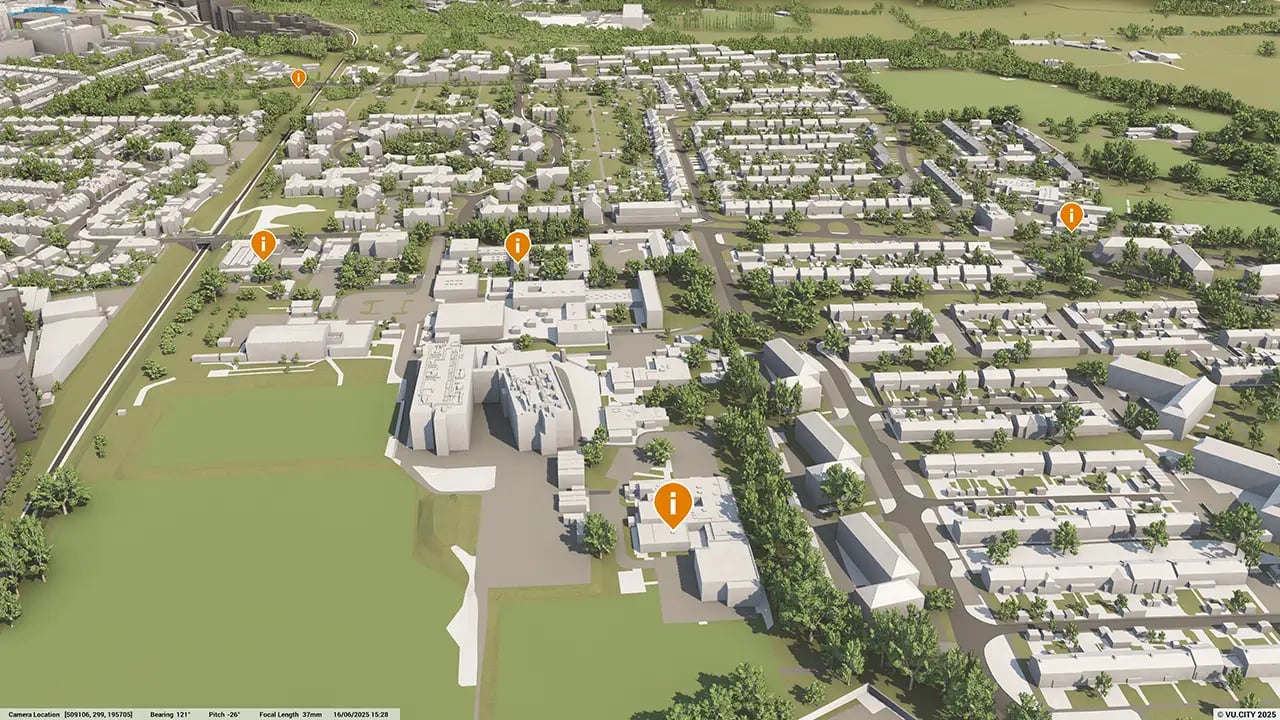
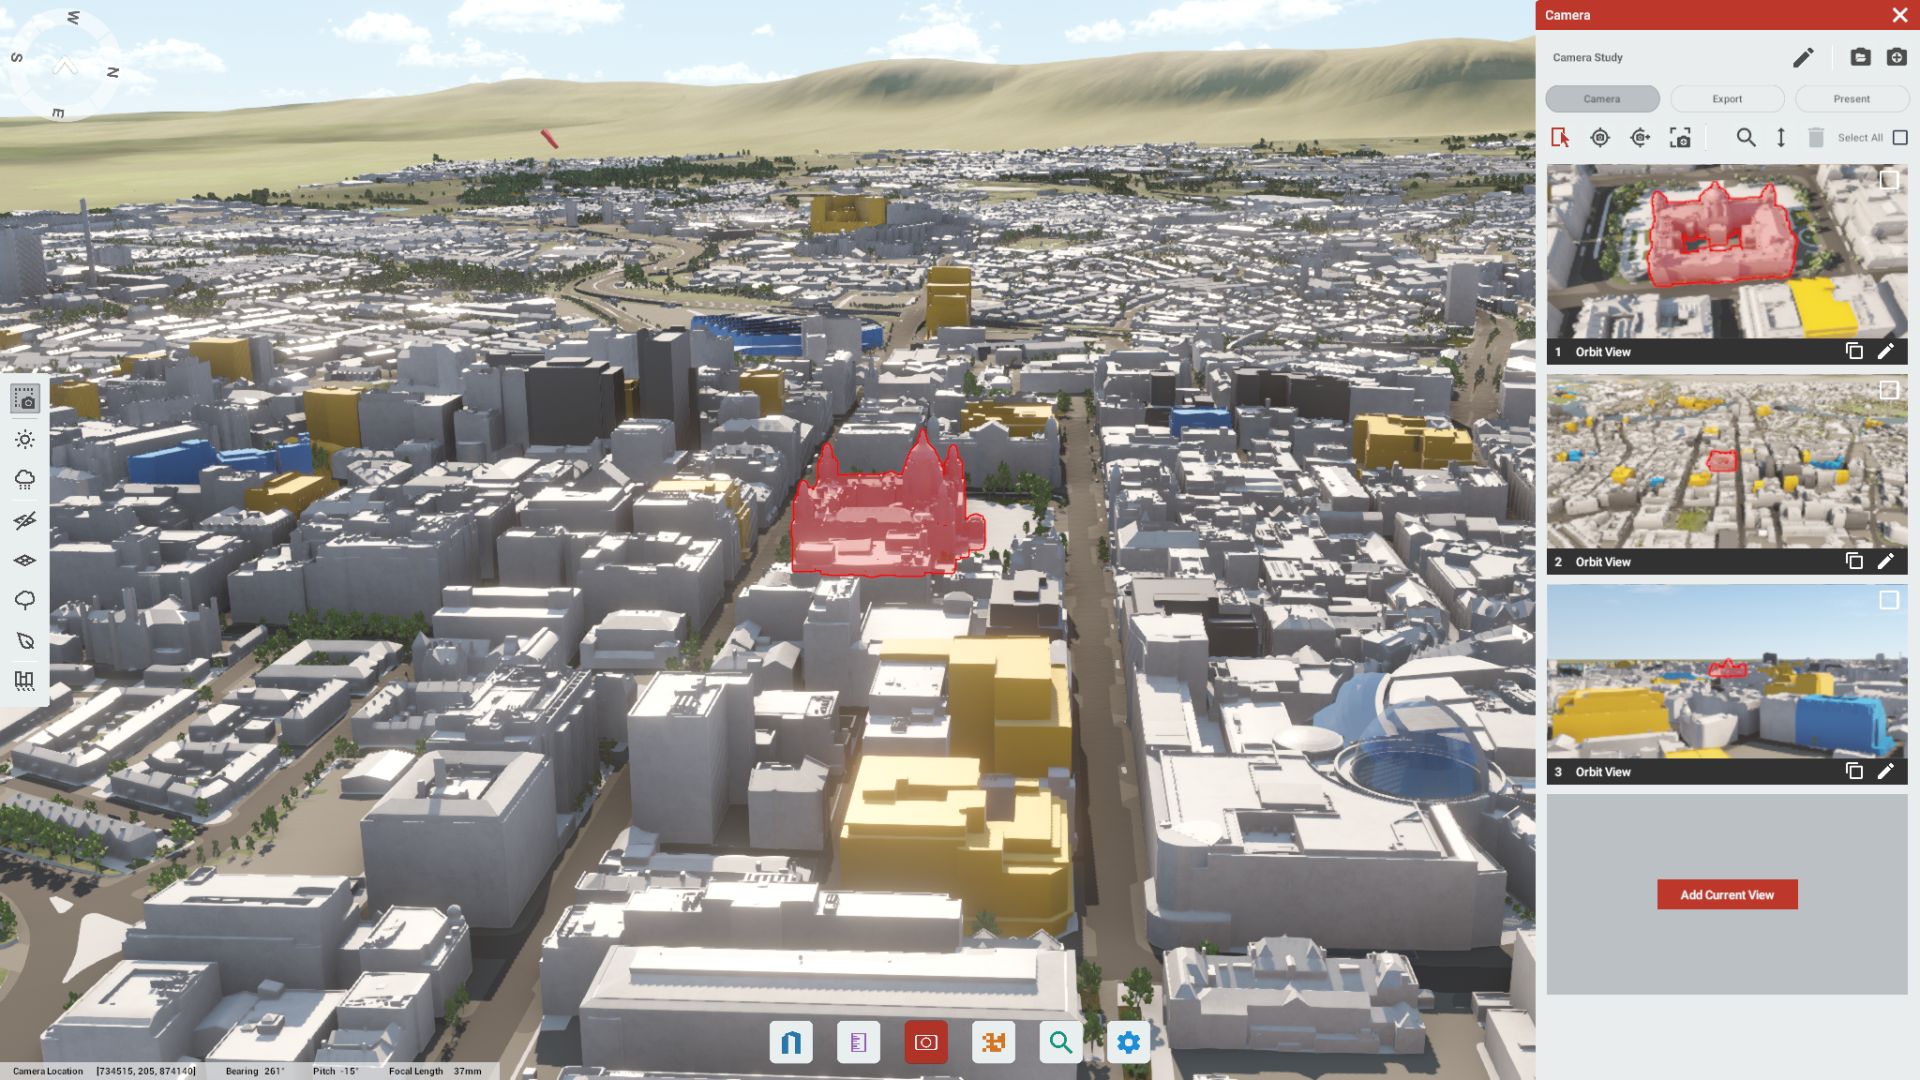
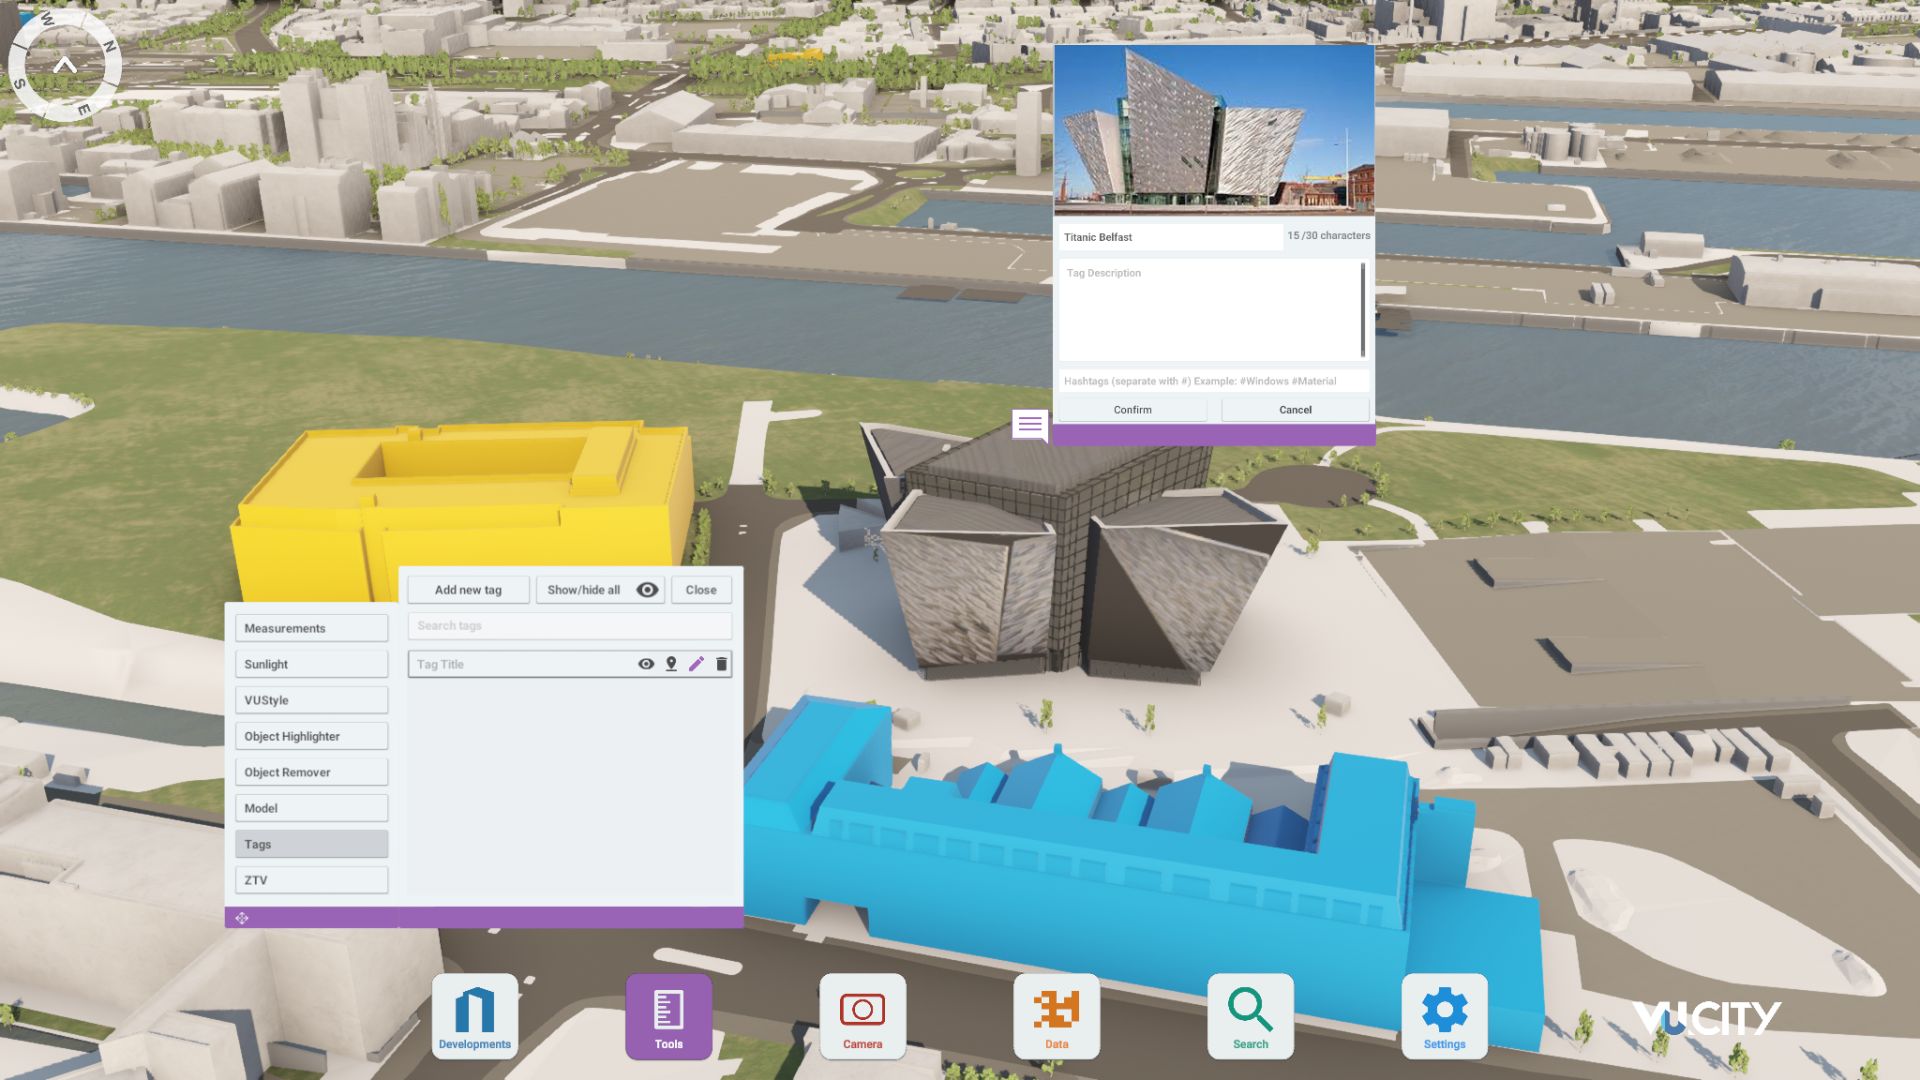
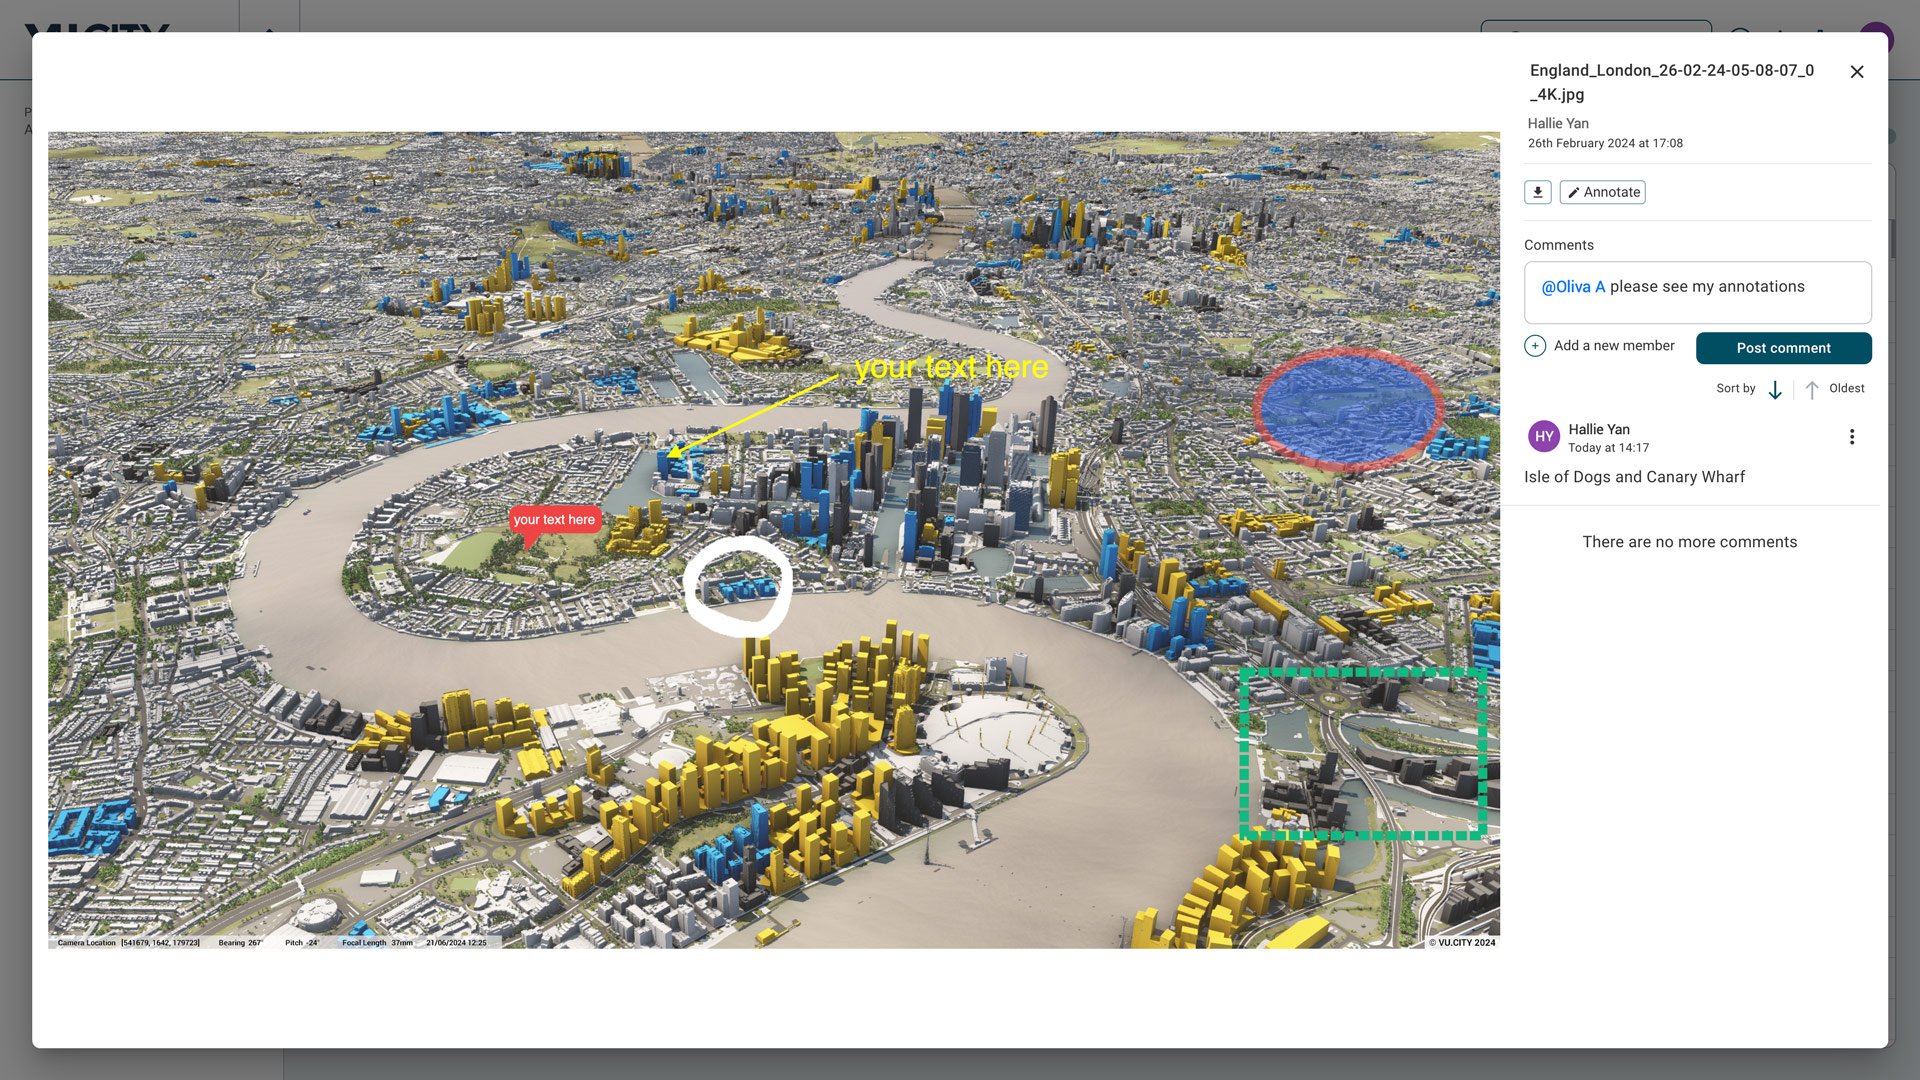
With features like the Camera Tool and annotation tags, users can create realistic visuals and engage stakeholders. This facilitates clear communication, allowing everyone to understand and contribute to design discussions.
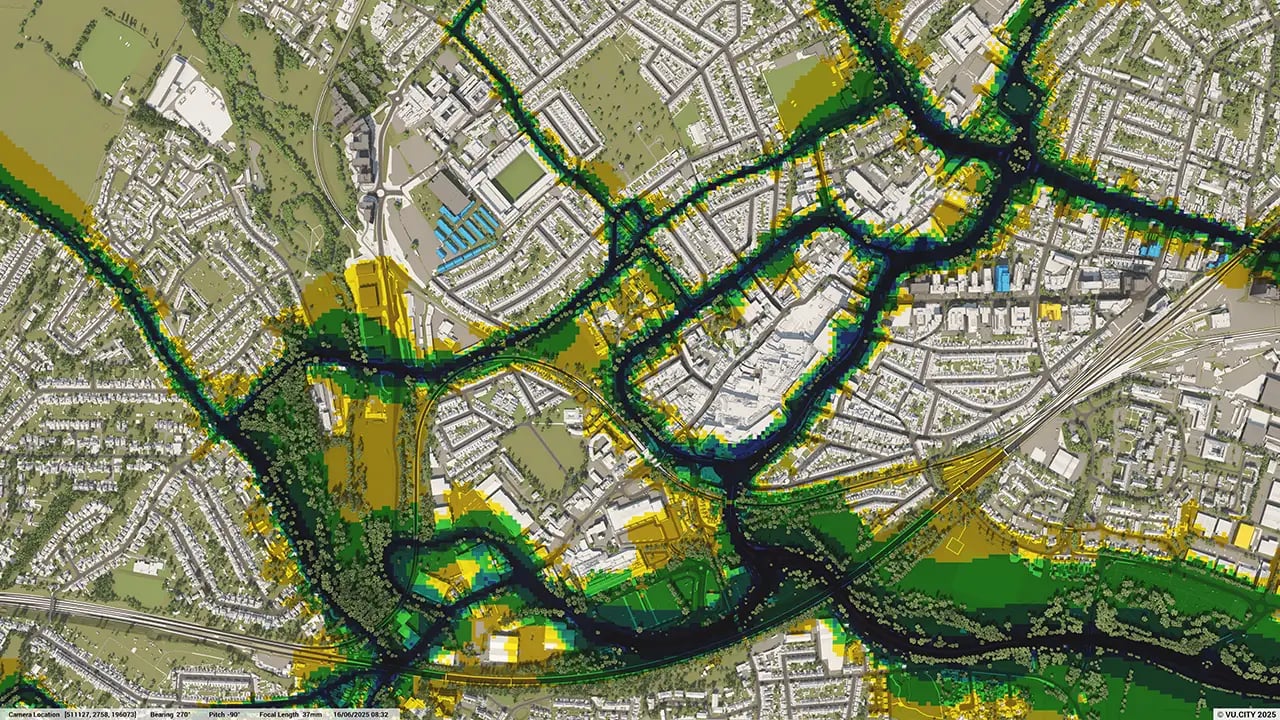
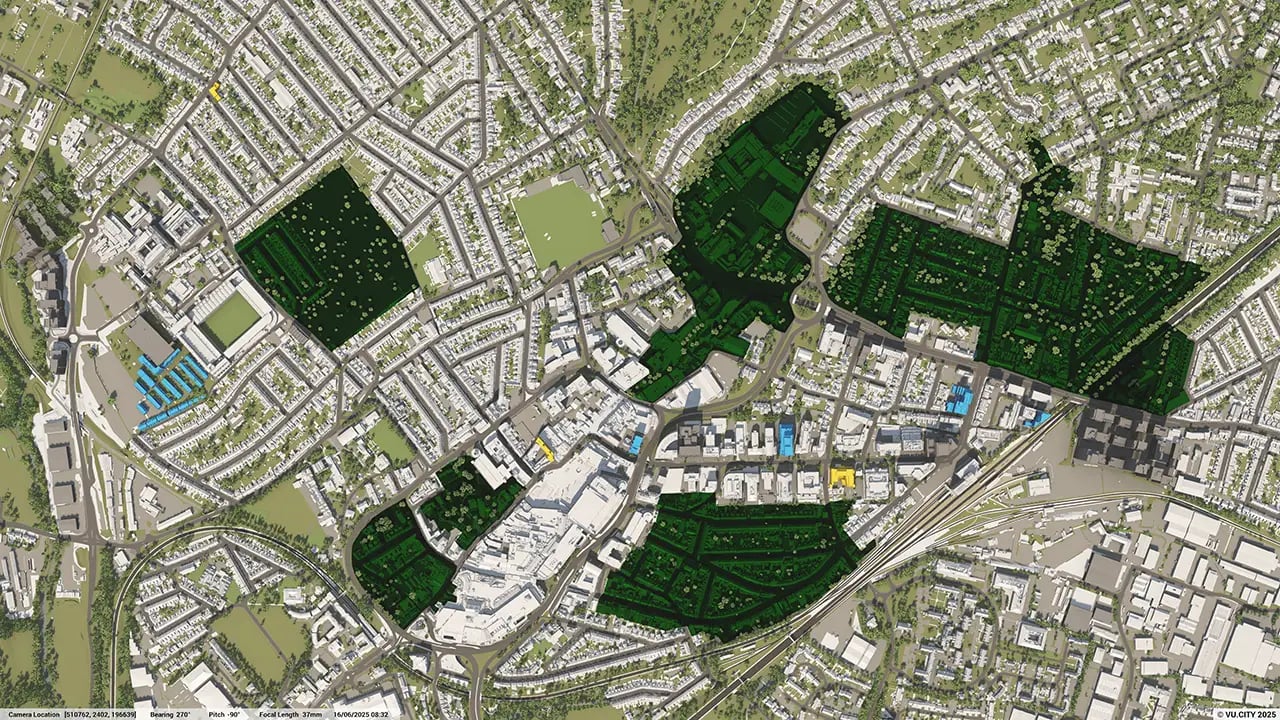
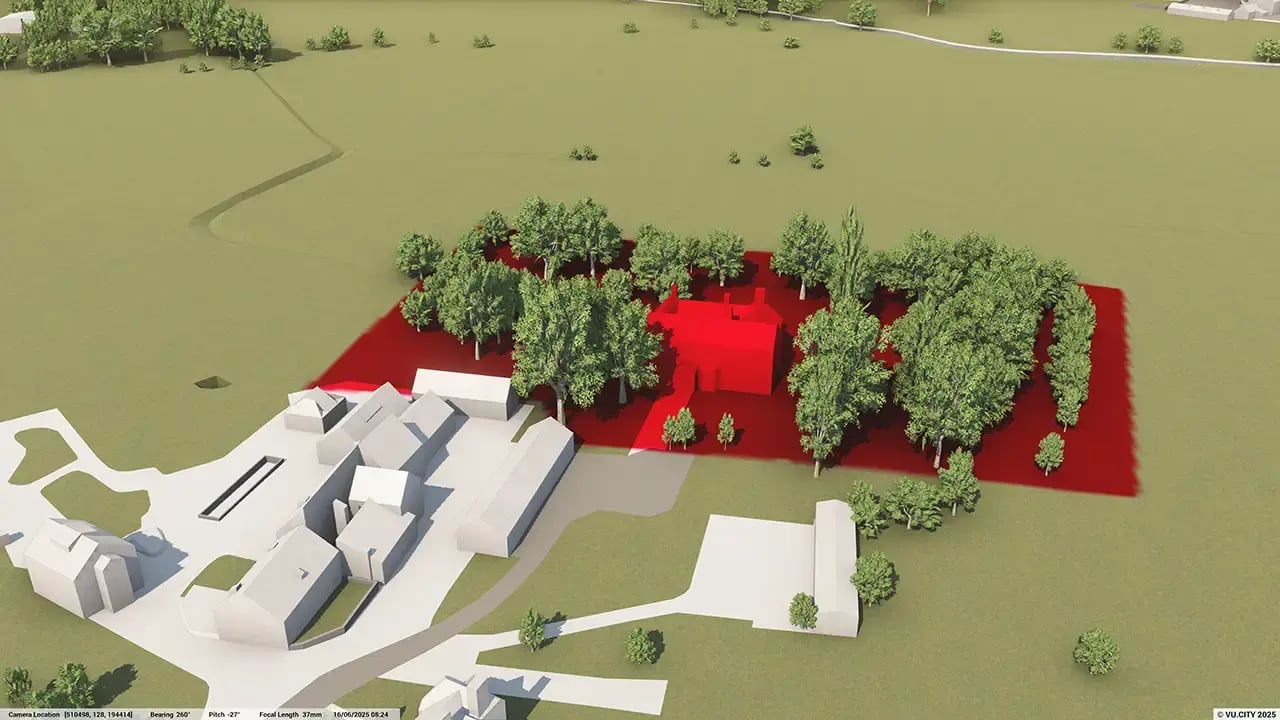
What environmental data layers are included in the Woking 3D model?
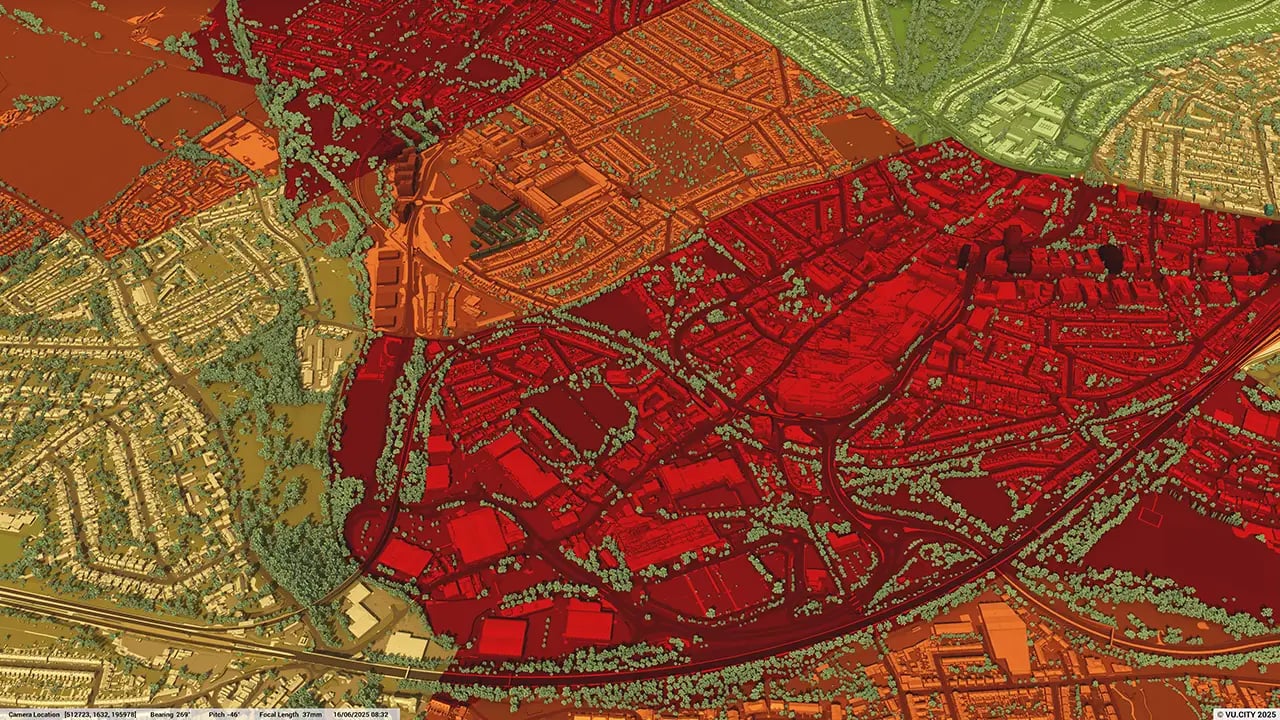
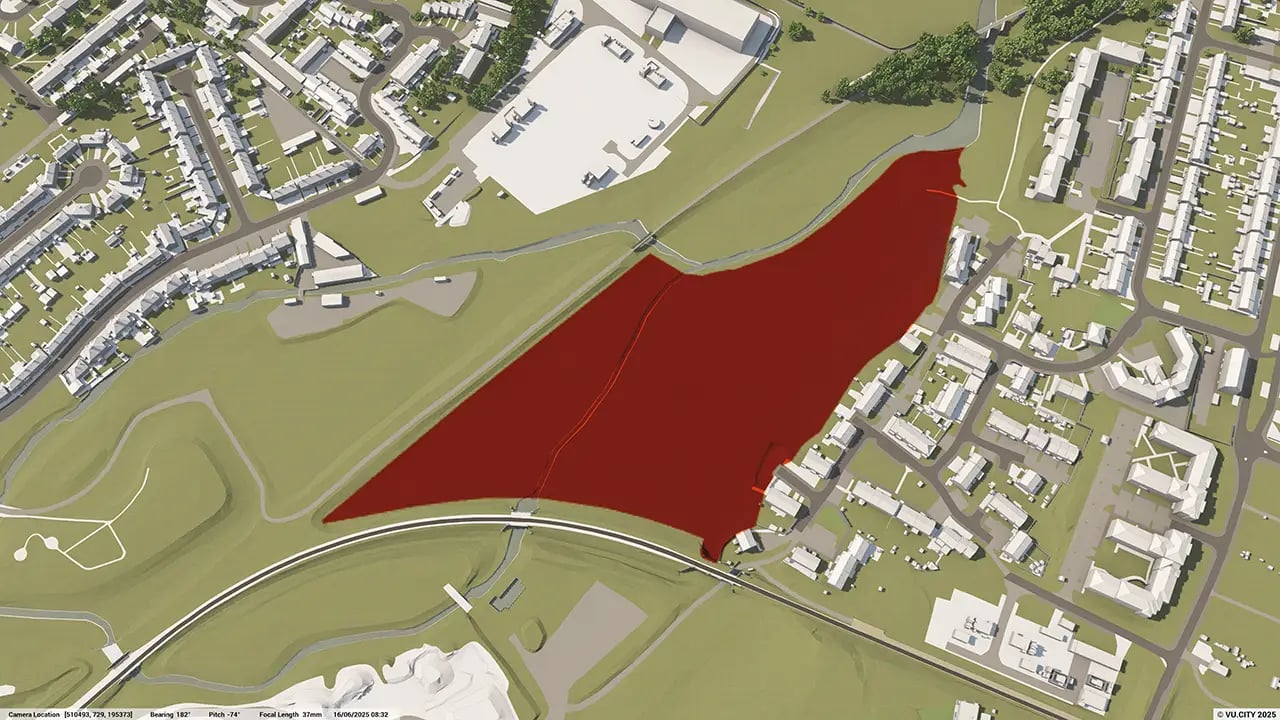
The model provides data on flood zones, green belt areas, sunlight impact, and conservation zones. These layers support developers in making environmentally informed decisions that align with Woking’s sustainability initiatives.
Who benefits from using the VU.CITY Woking model?
Architects, planners, developers, and local authorities all benefit. The model enhances collaboration, streamlines the planning process, and supports Woking’s strategic development vision, balancing growth with conservation and sustainability needs.
Explore digital 3D geospatial solutions for the built environment
VU.CITY provides clear, powerful tools for key decision-makers across the built environment, helping them visualise and shape the future of cities with confidence and precision.
Make smarter decisions with data-driven insights, from infrastructure to sustainability.
Unlock the power of Generative AI for optimal design and streamlined decision-making.
Bring your designs to 3D life with state-of-the-art modelling tools.
Collaborate seamlessly across studies, planning, and design.
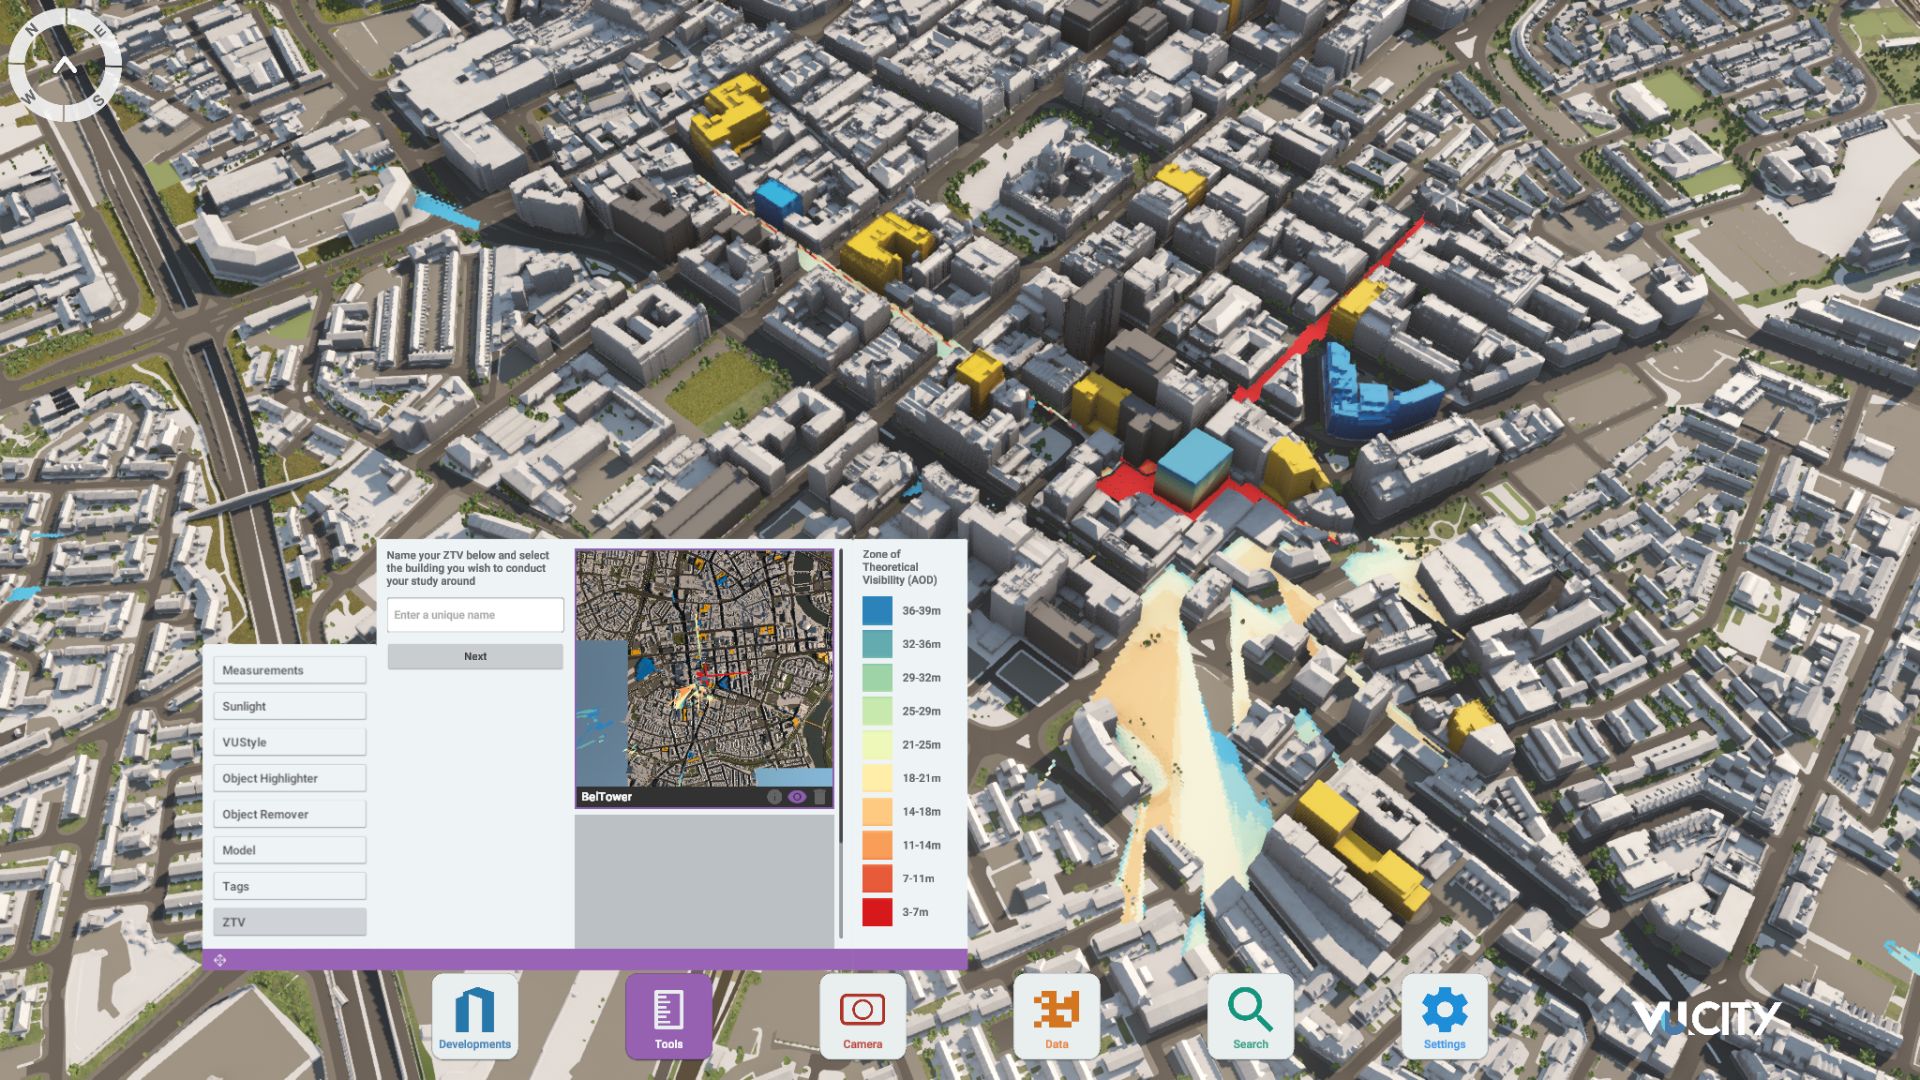
Utilise advanced 3D models and a data-driven approach with our flexible ZTV service.
Bring Your Vision to Life with a 3D Flythrough Video.
26 UK & International Cities
Over 3,000+ sq km accurate to 15cm | Tools to scope, create & collaborate on designs
Shape Tomorrow’s Cities, Today.
Begin Your Free Trial Now.