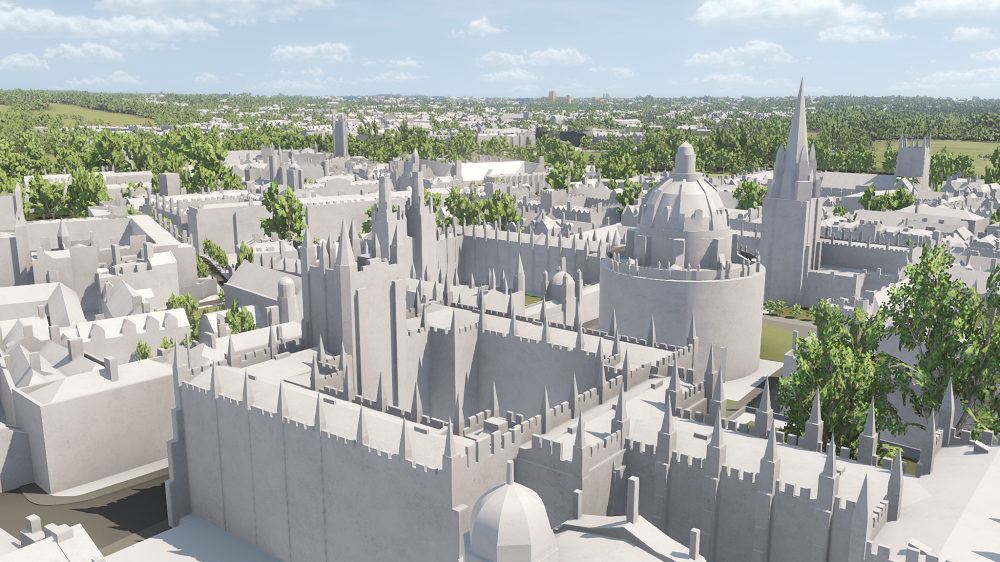

VU.CITY OXFORD: HIGHLIGHTS

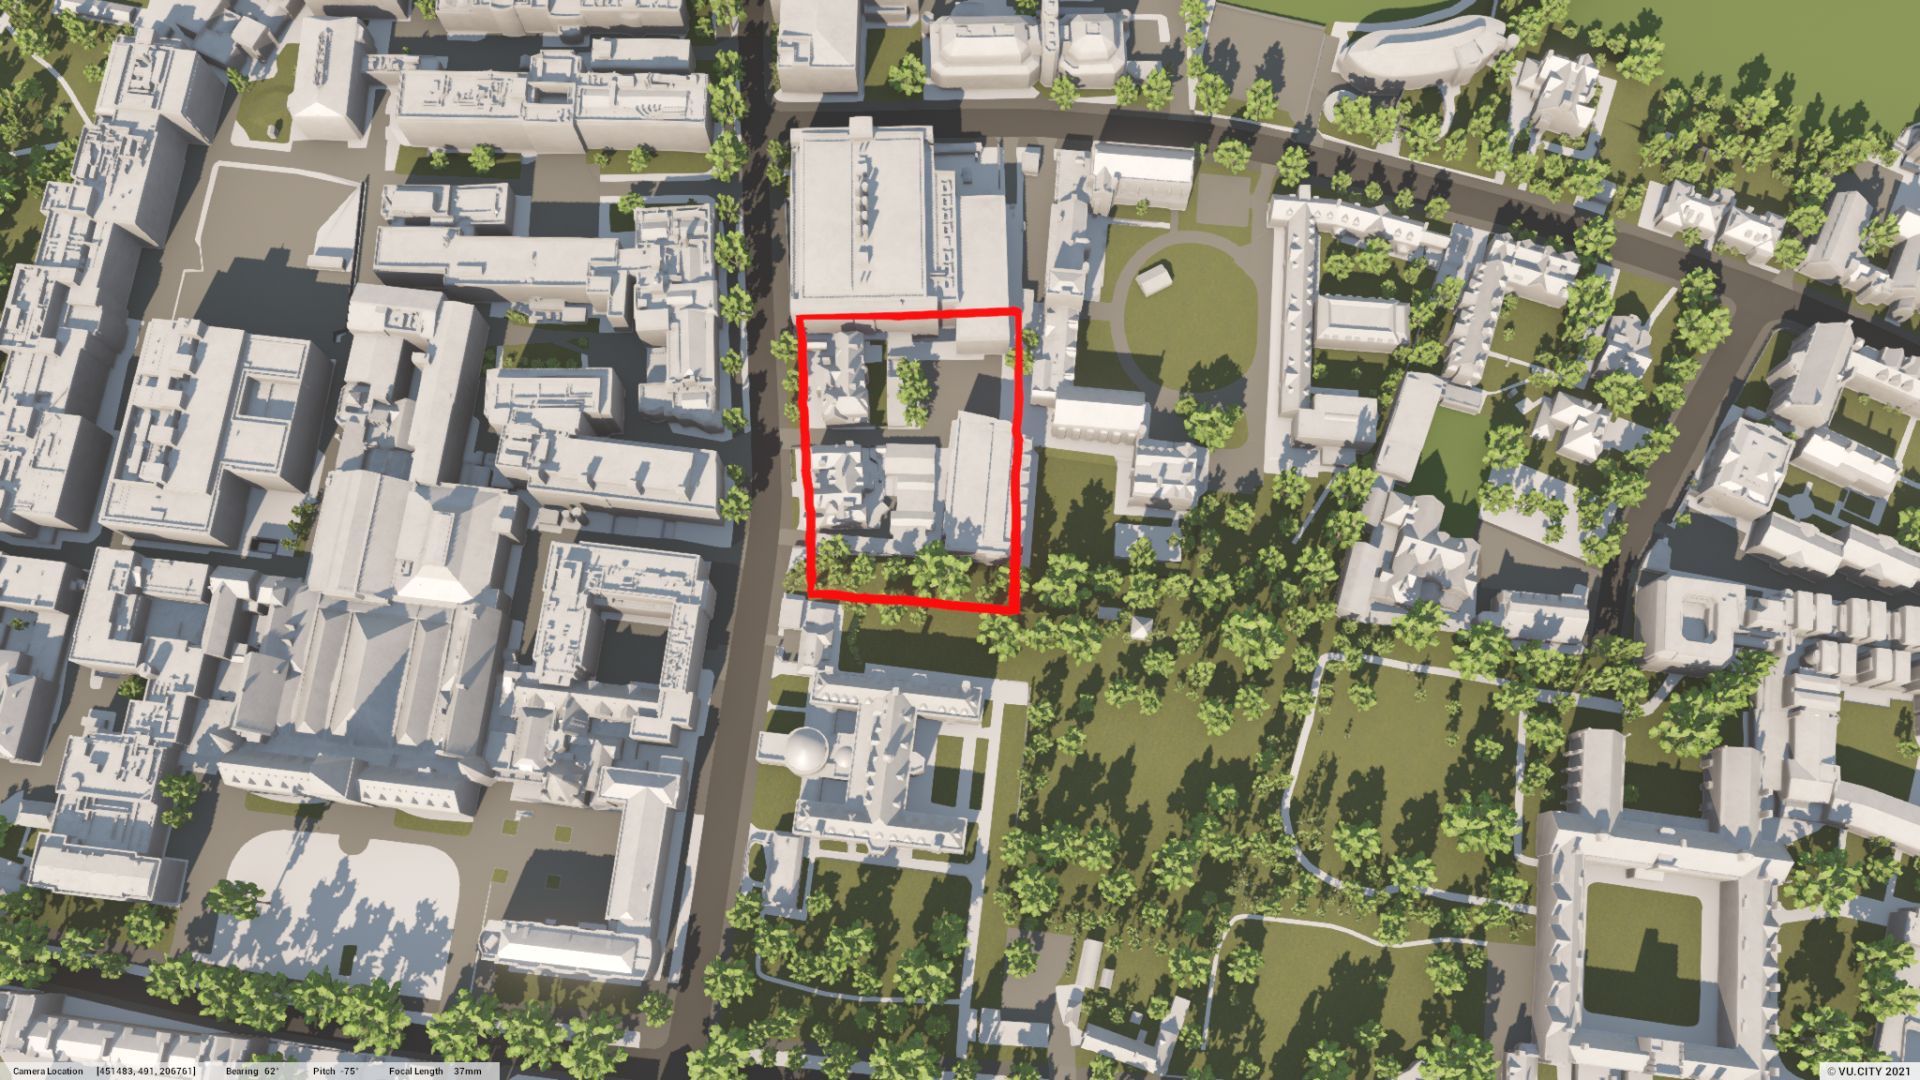
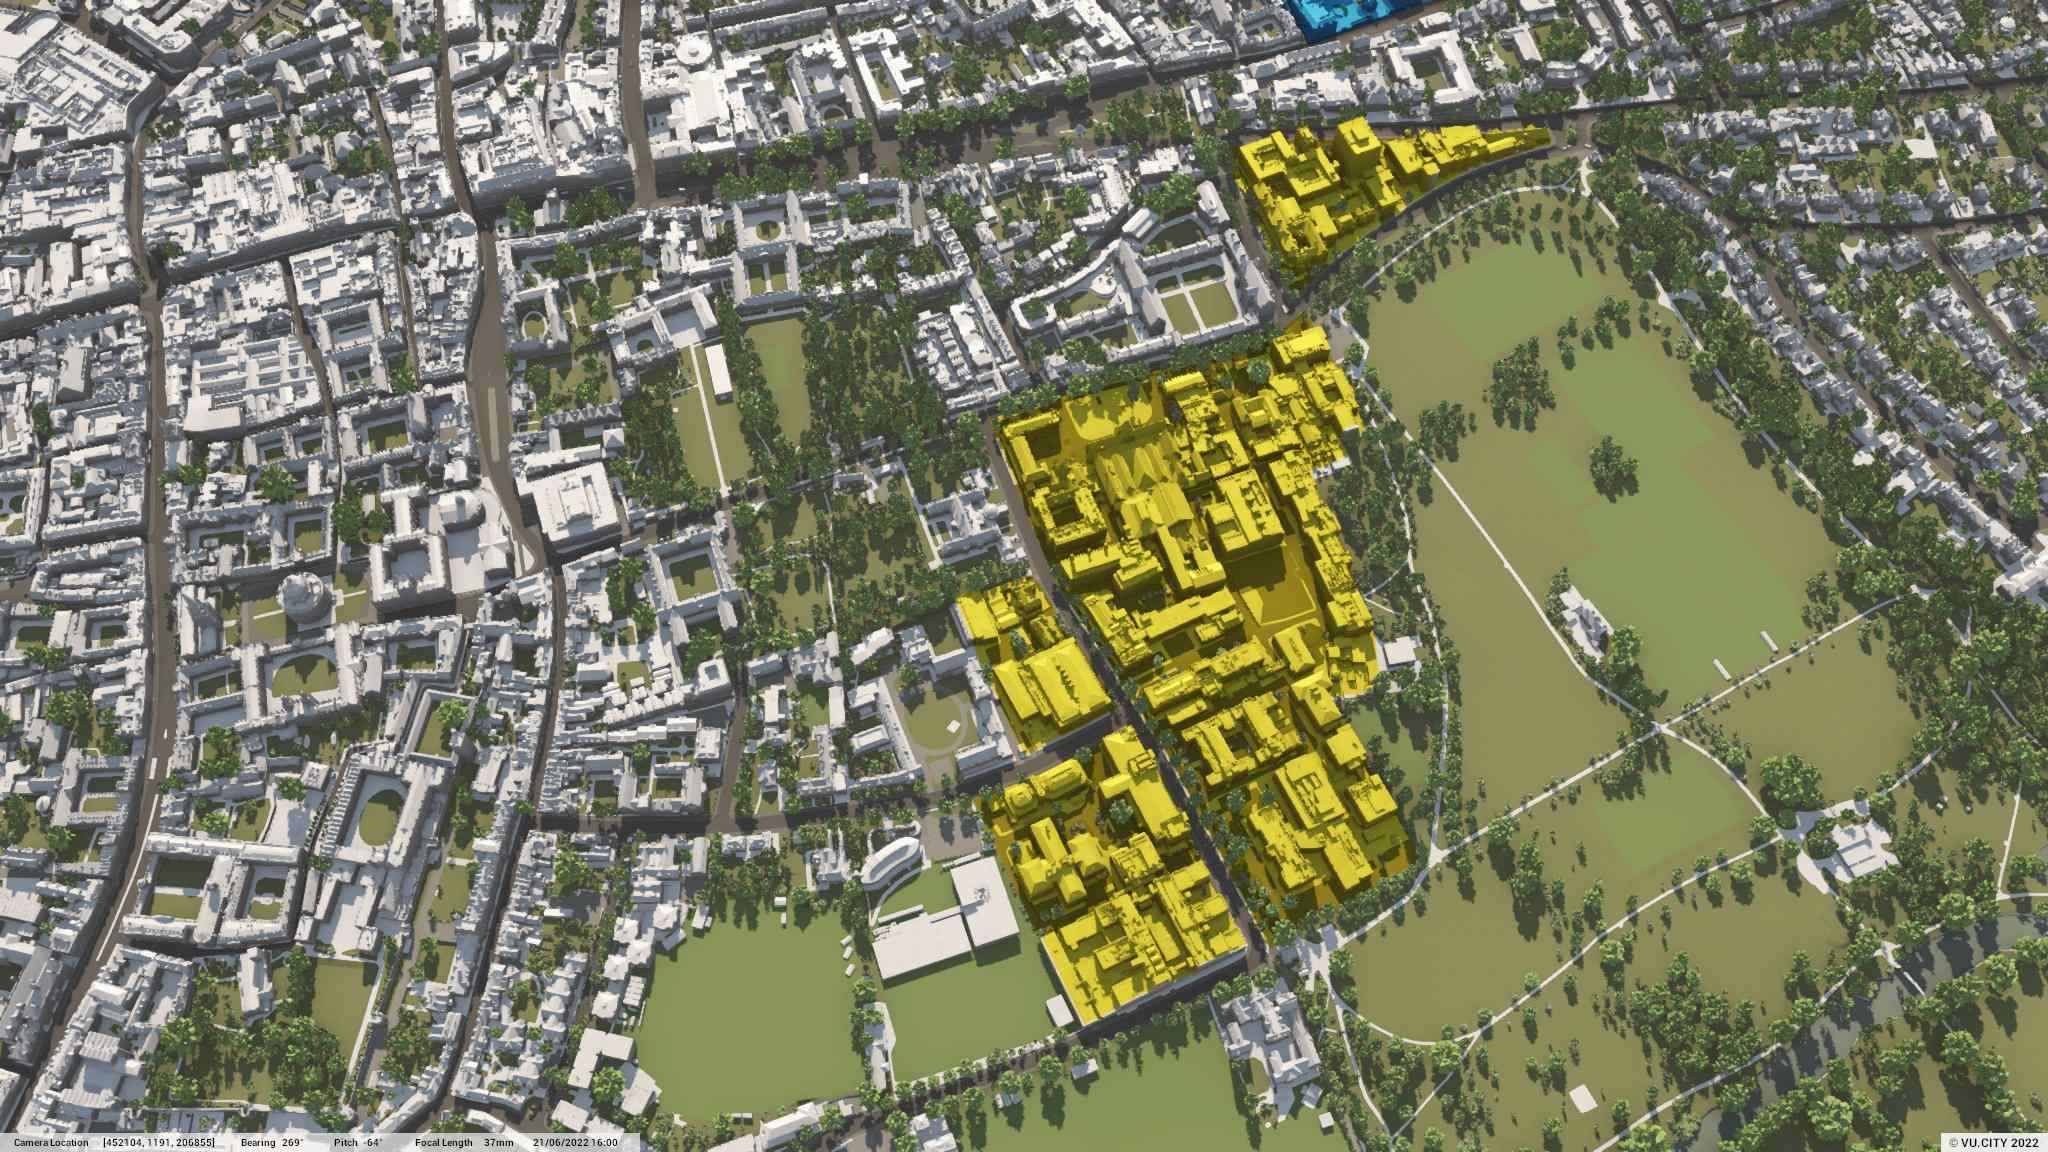
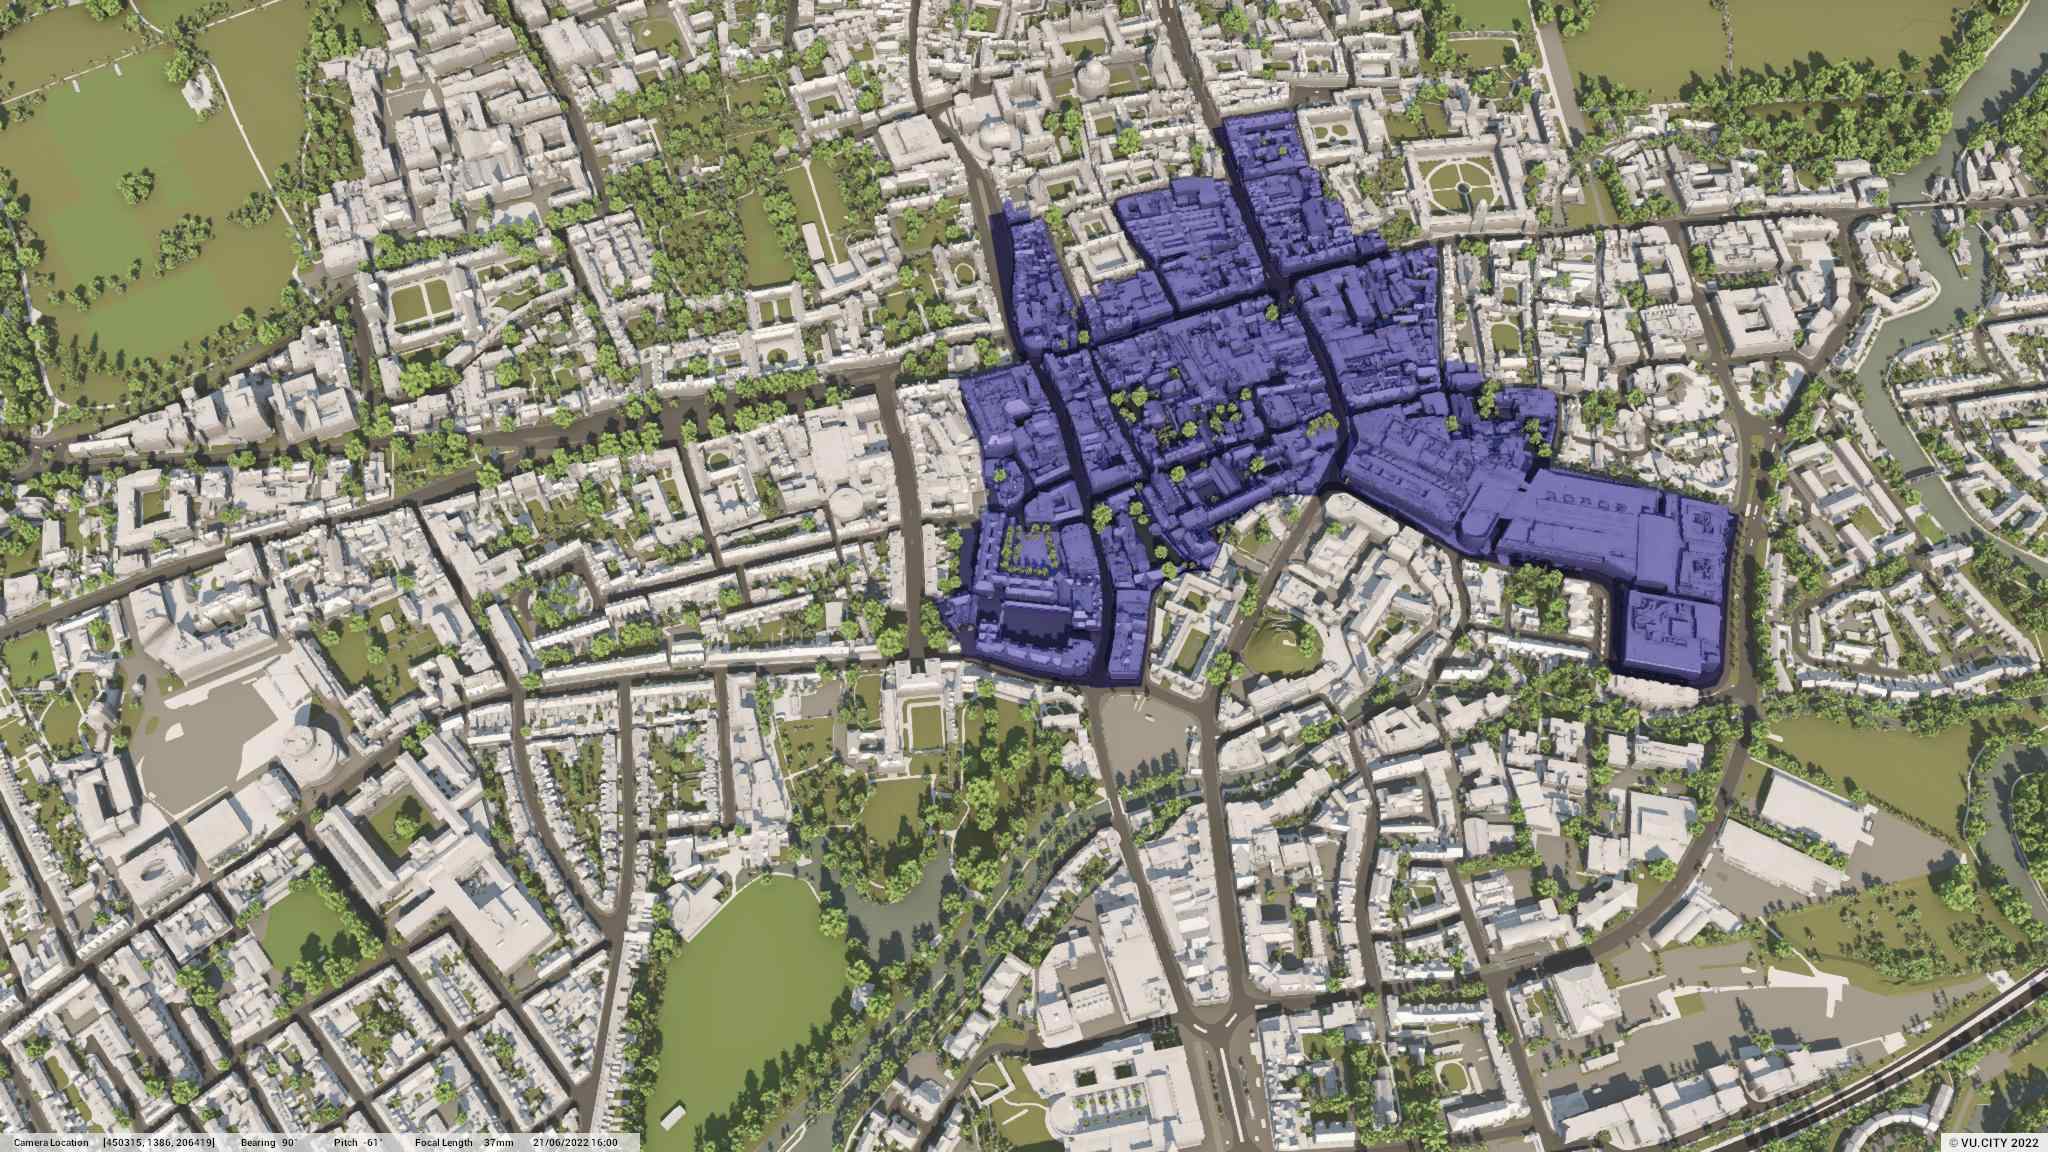
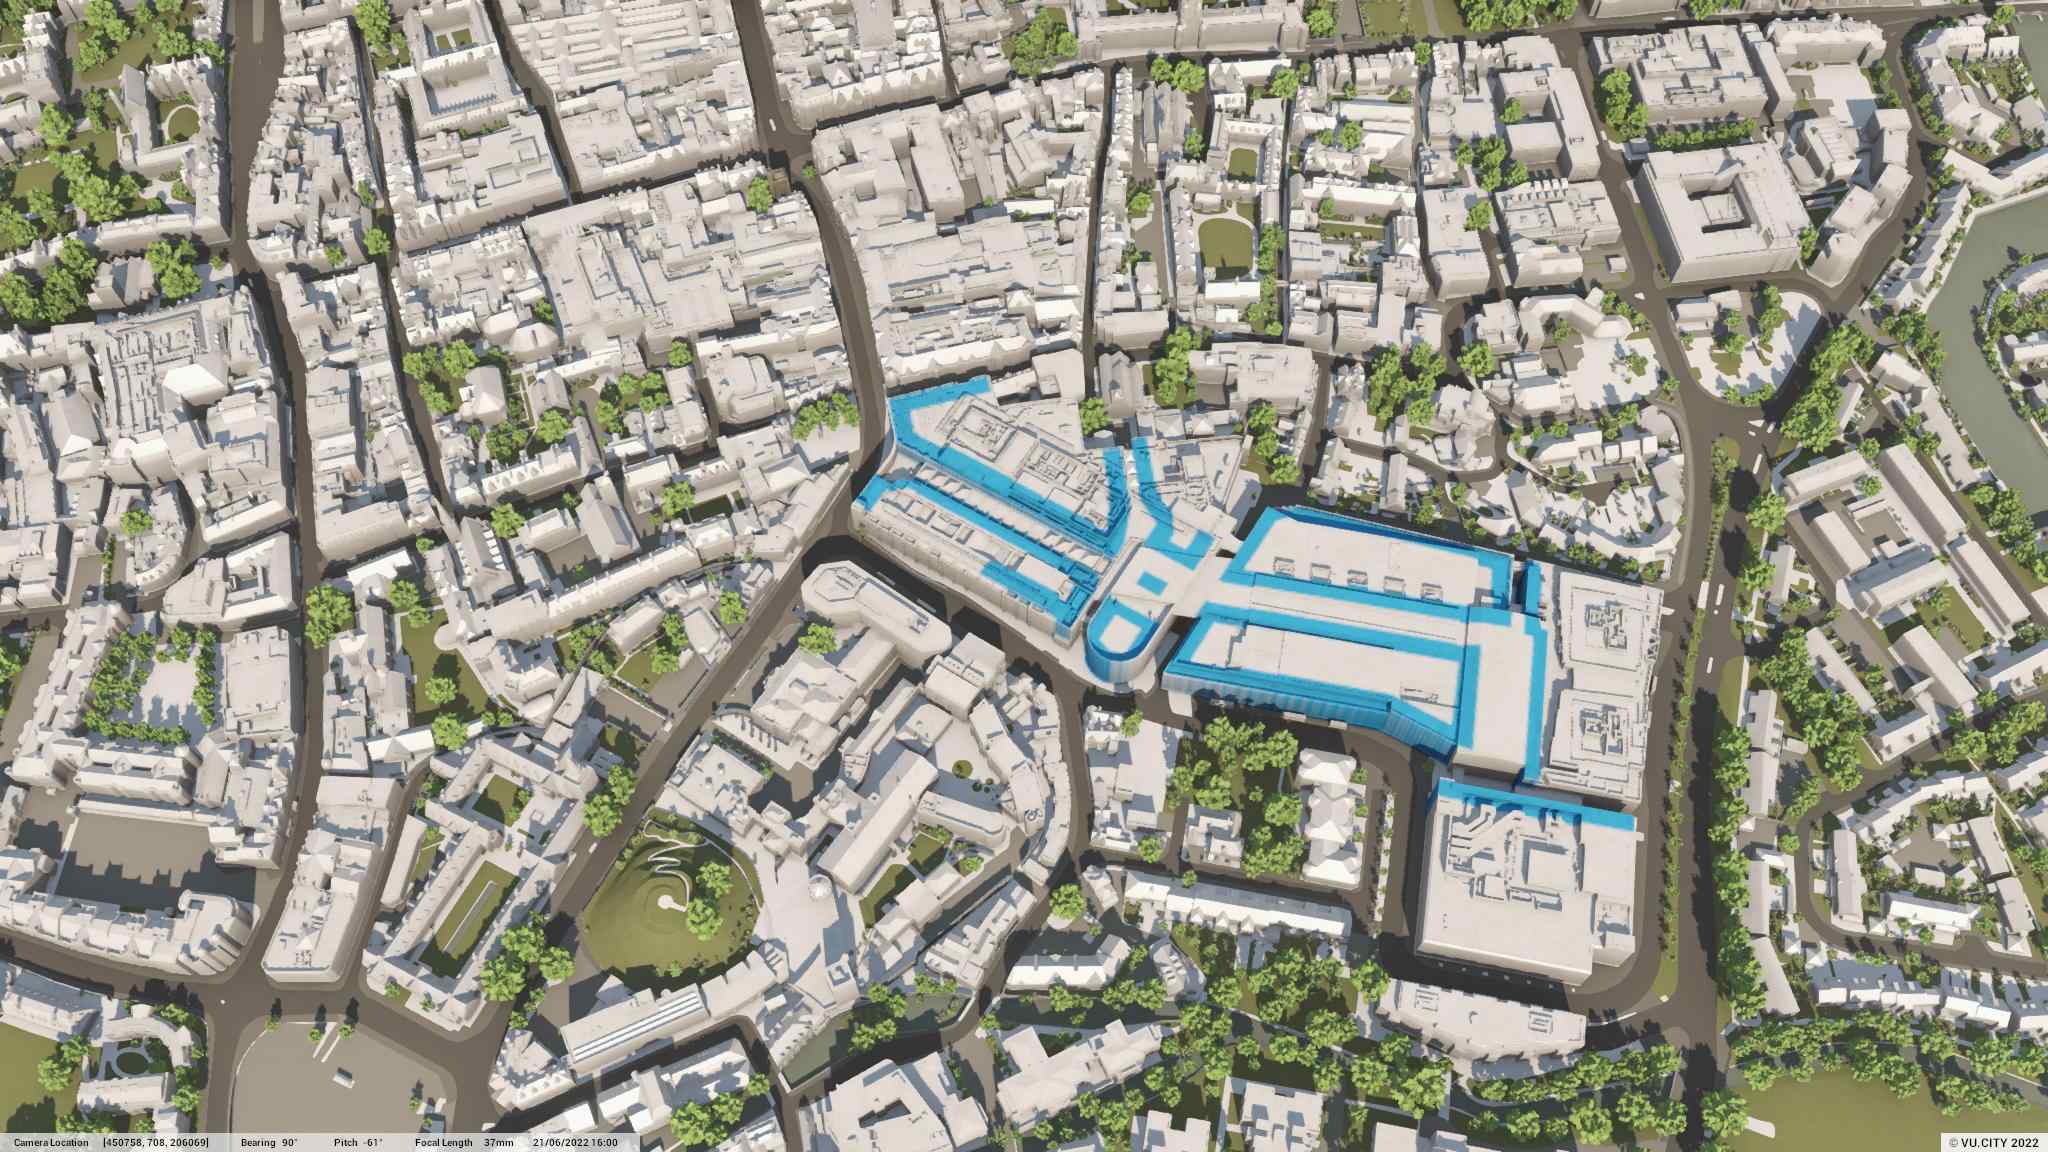
Test Massing
Assess multiple initial massing options at an early stage and GEA potential quickly.

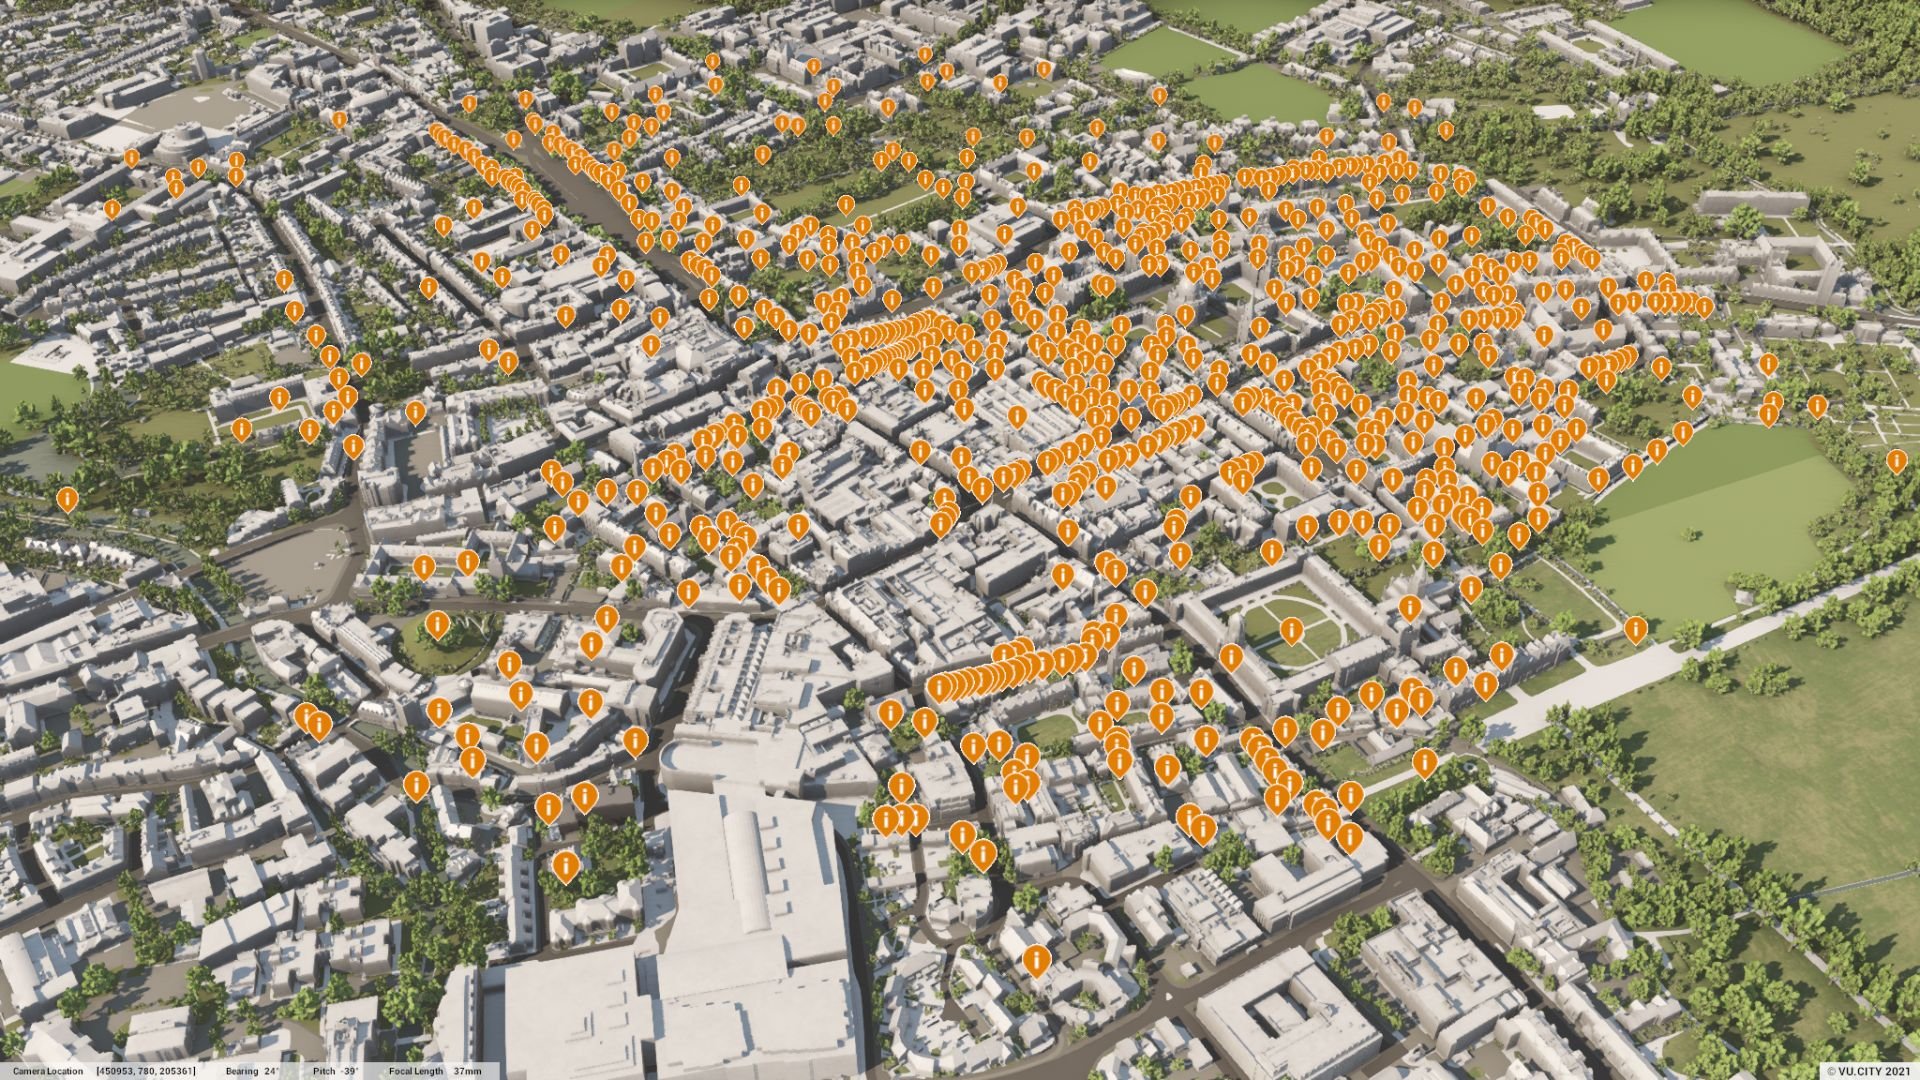
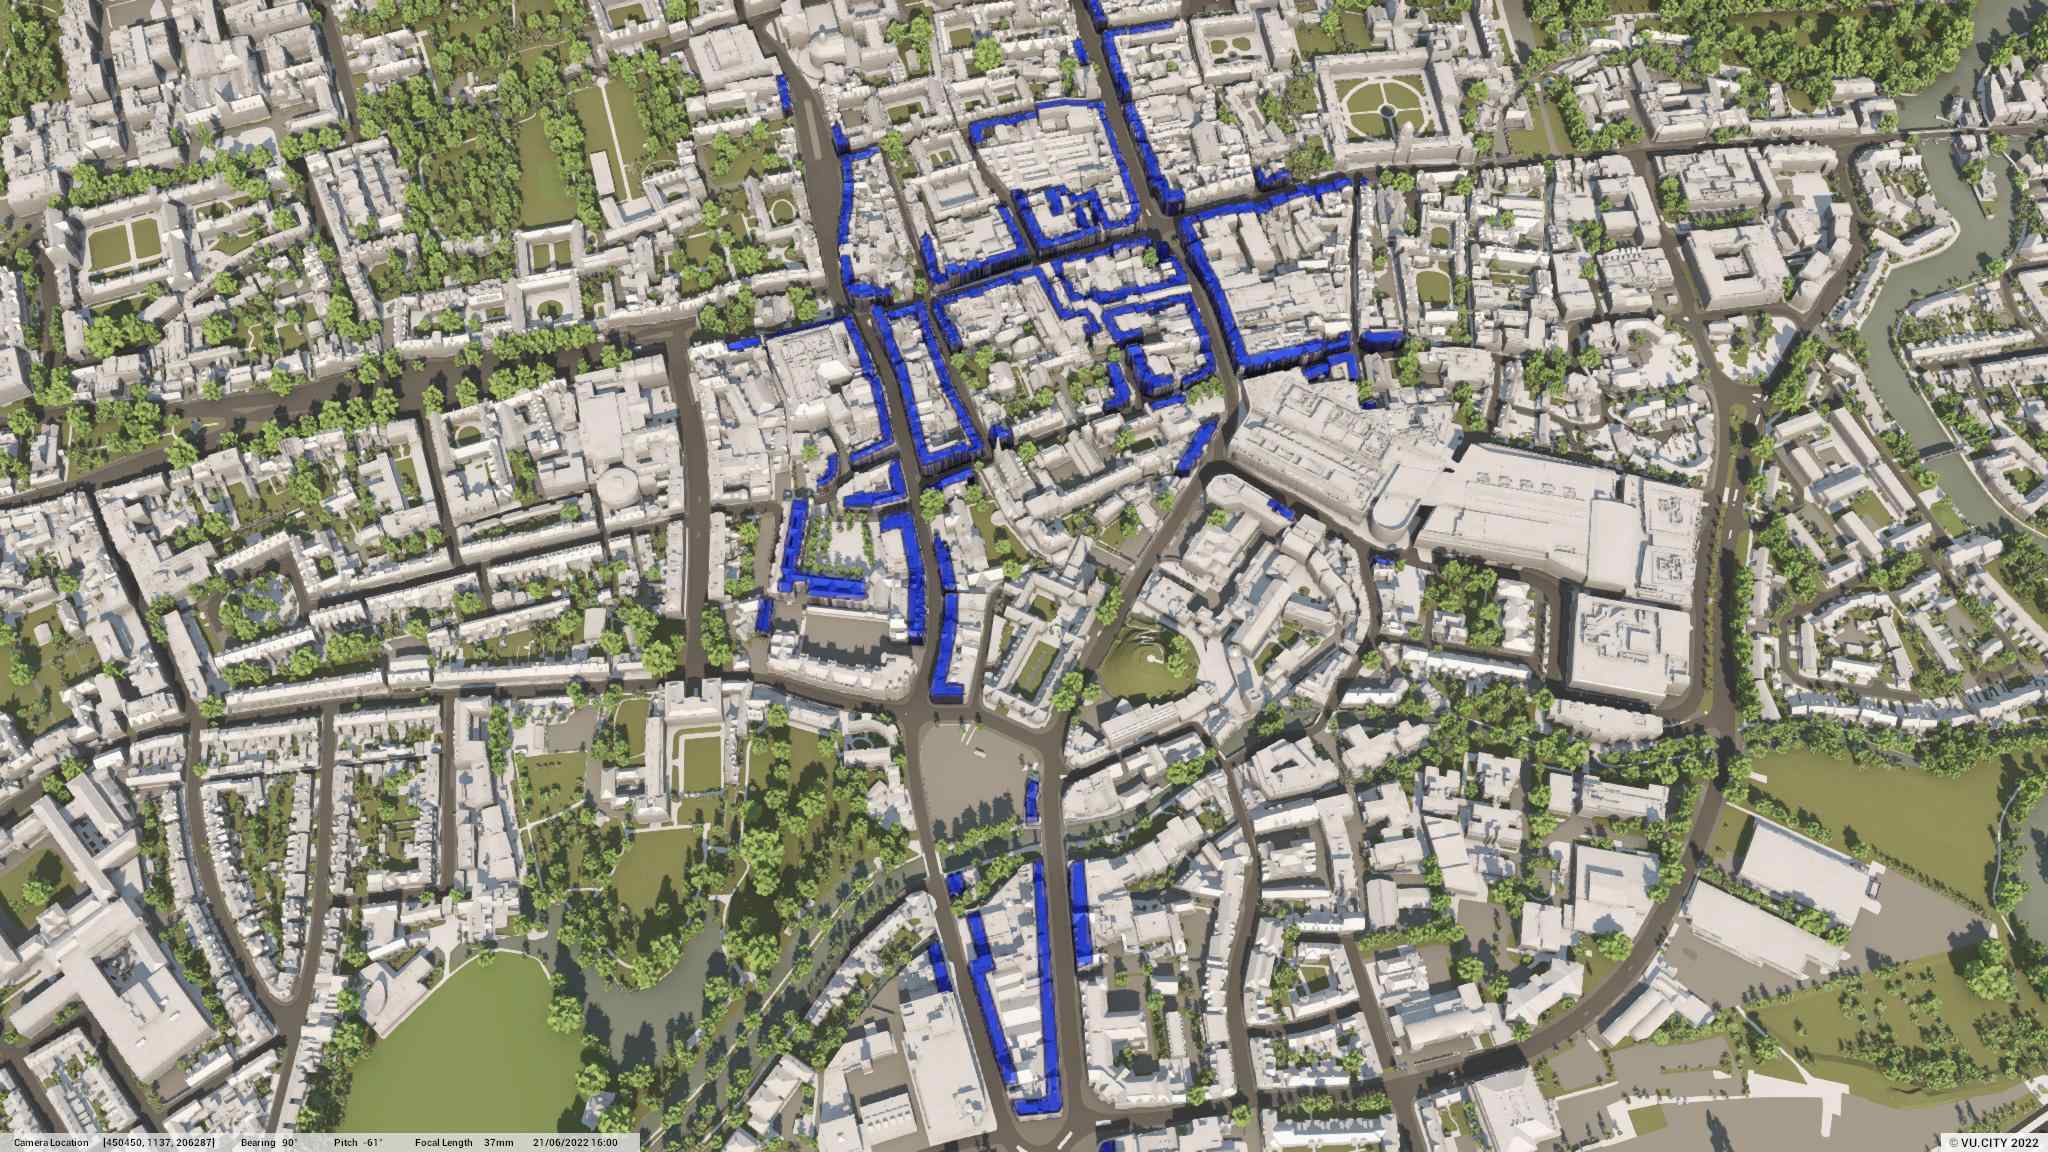
Consented Schemes Timeline
Realise a site’s potential by viewing and assessing recently consented developments across Oxford.

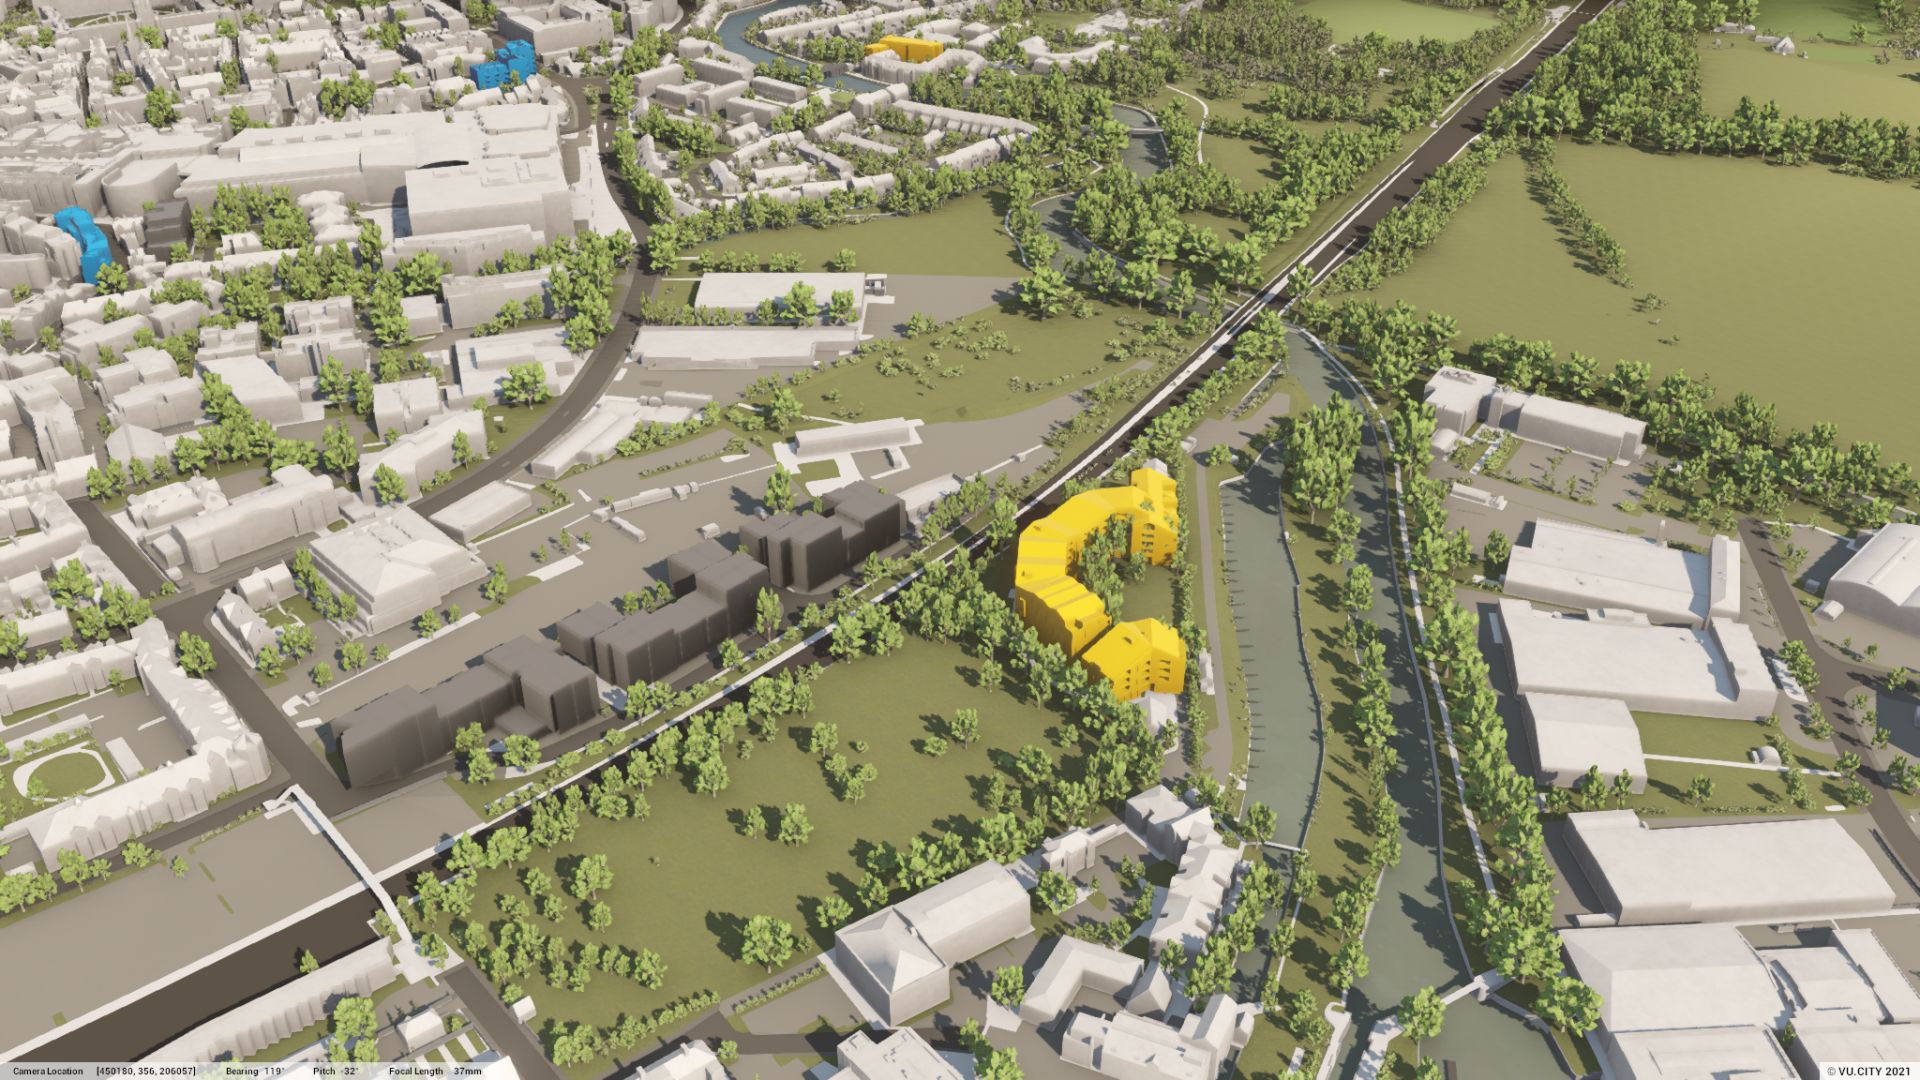
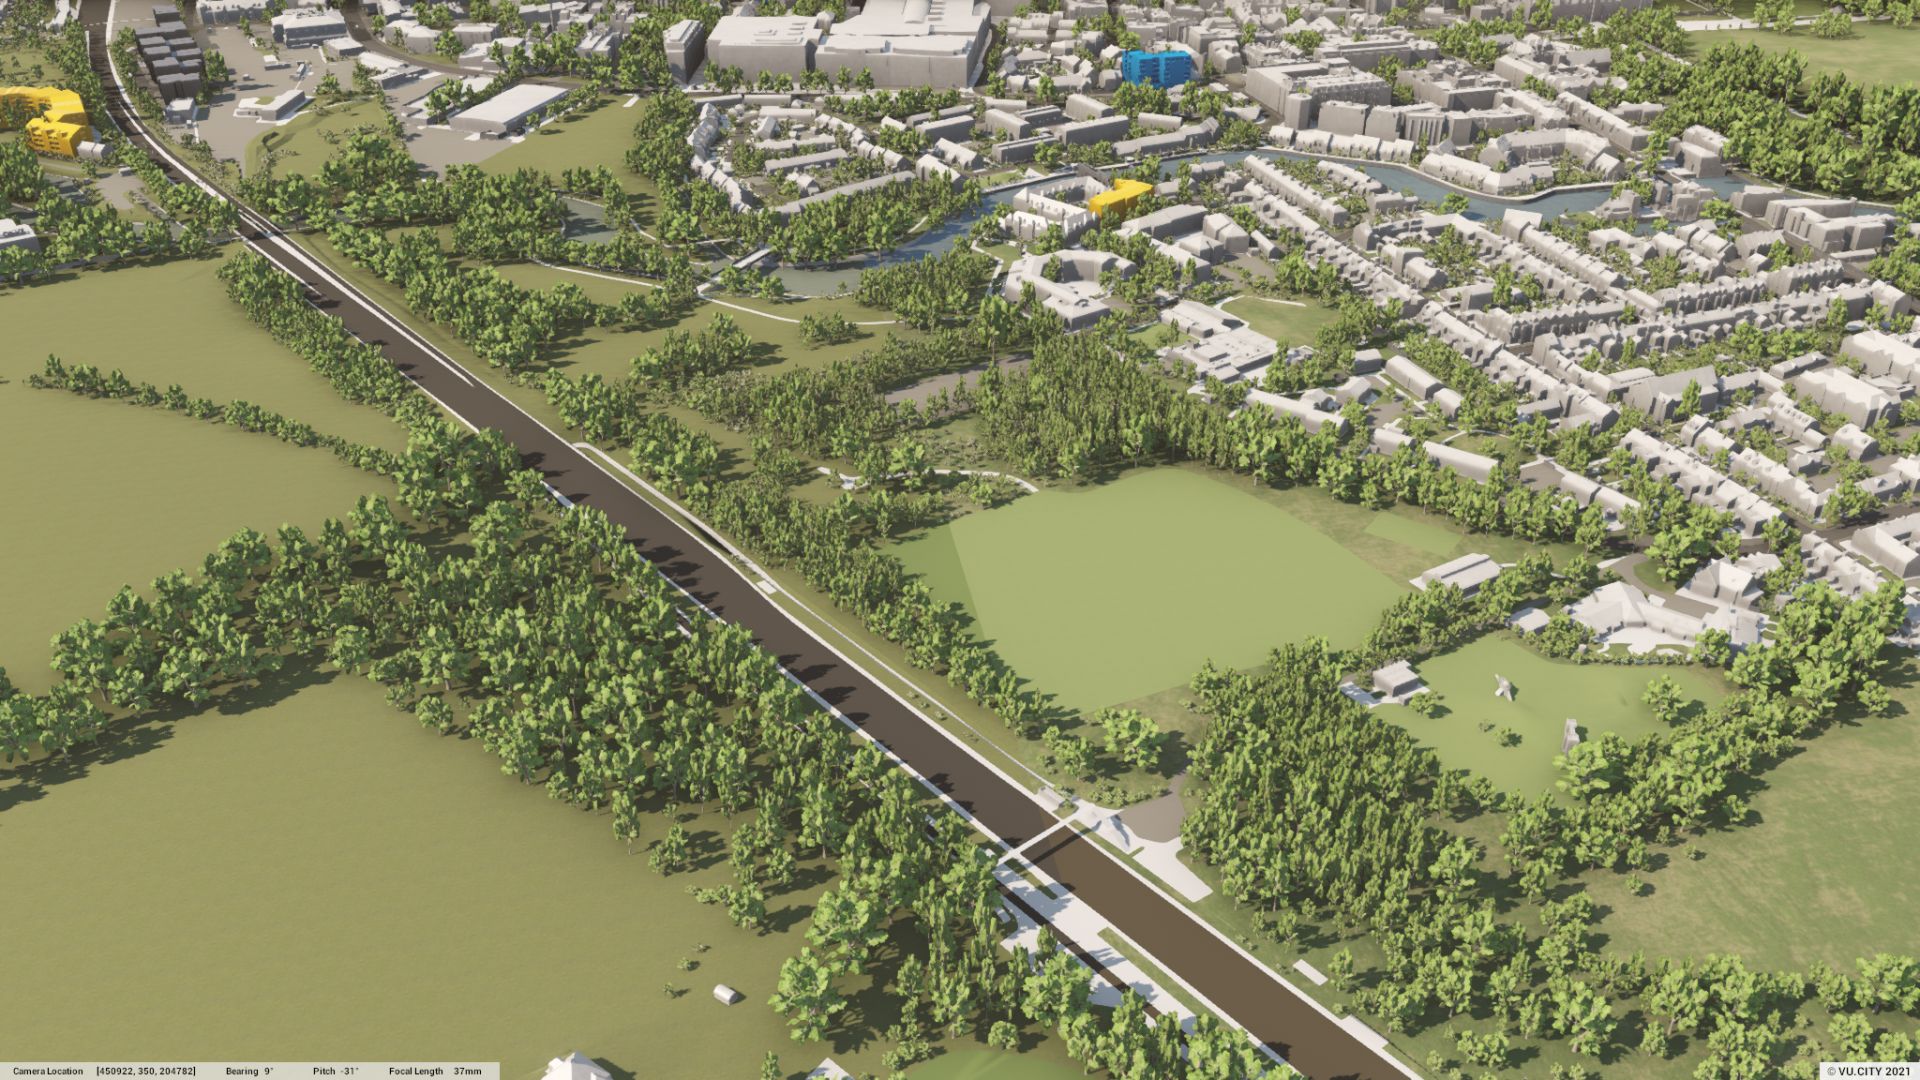
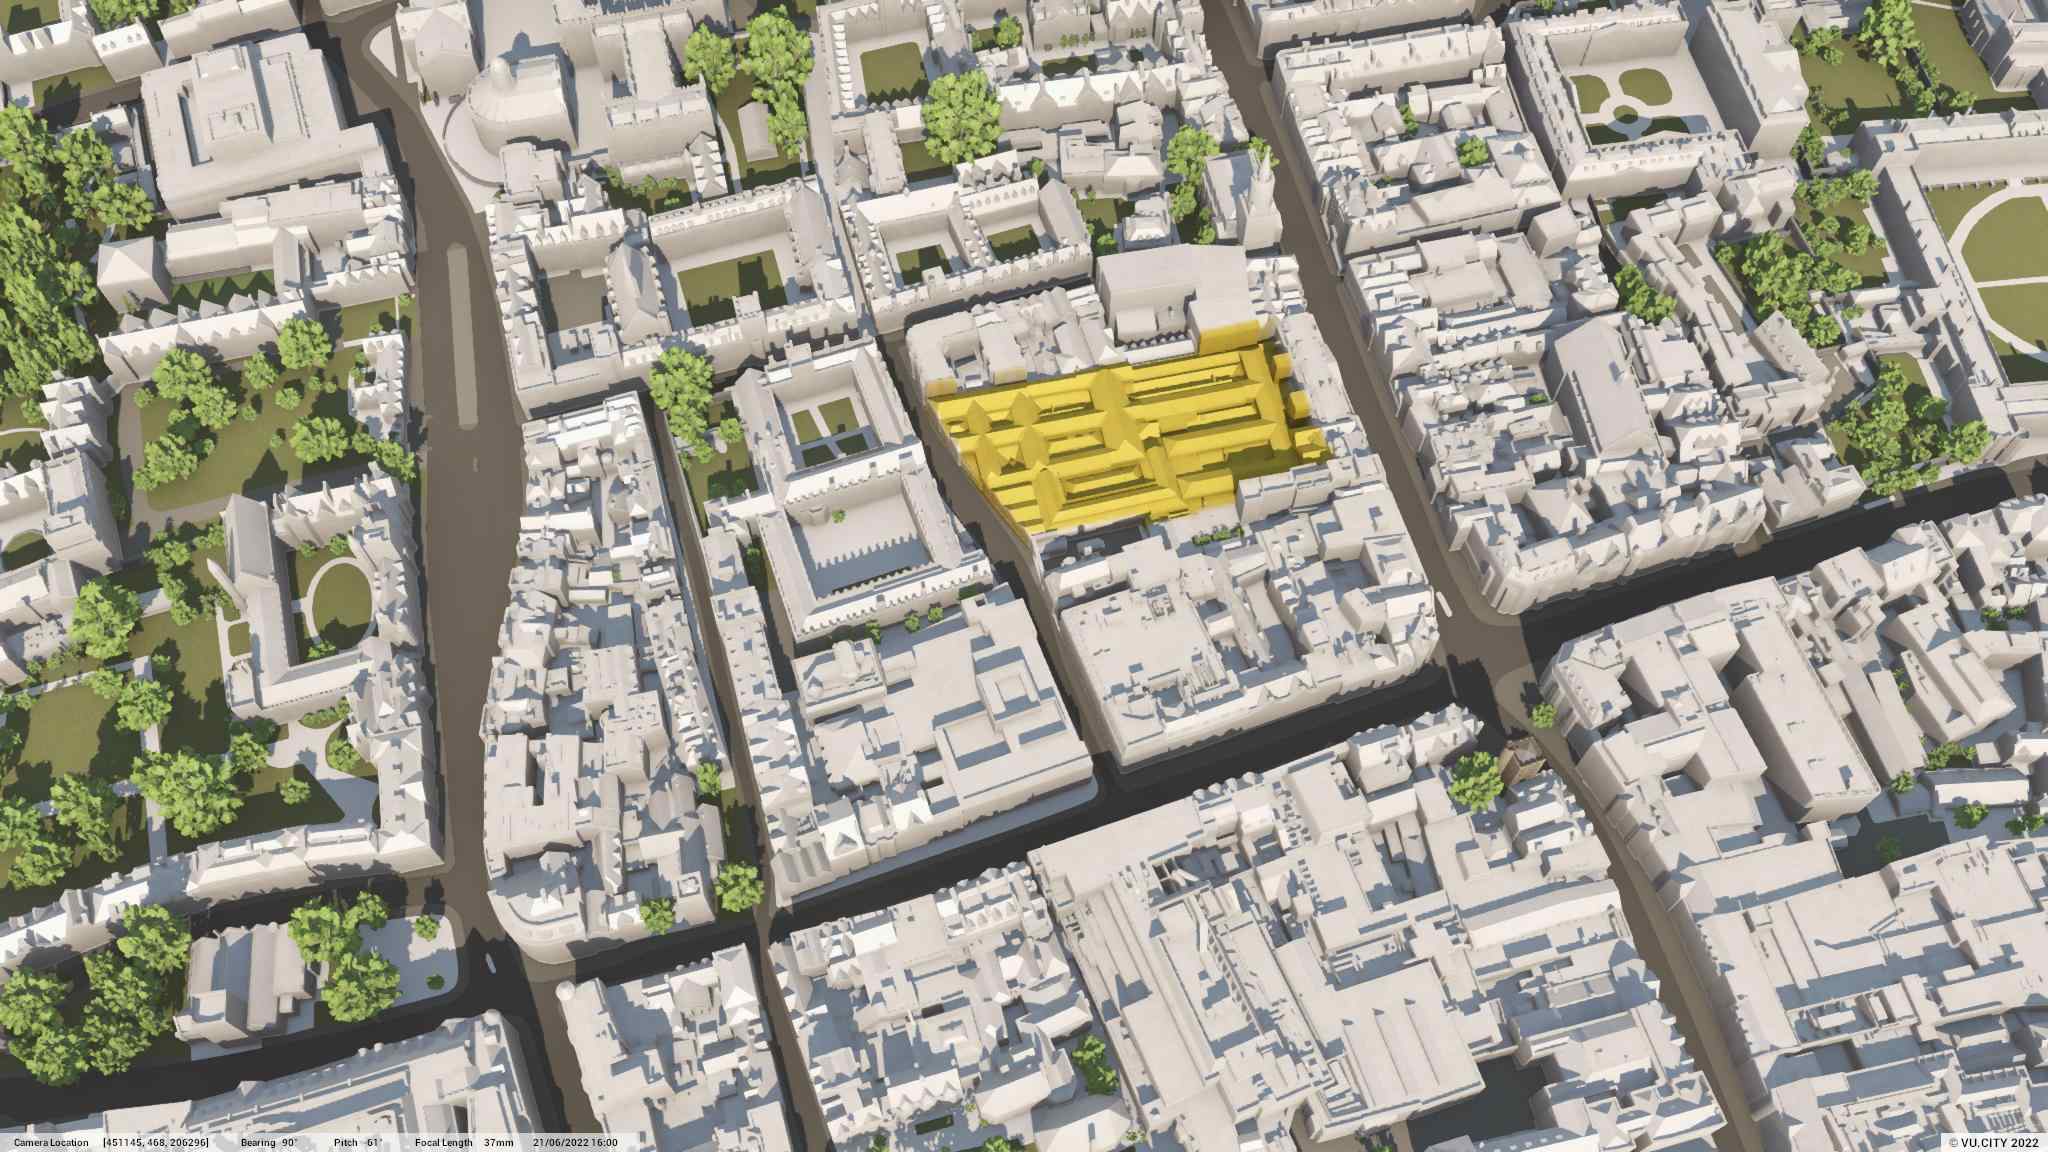
Import Designs
Easily import your designs from external 3D software (such as Revit, Rhino, SketchUp & 3ds Max) into the Oxford model and test how they will work in situ.

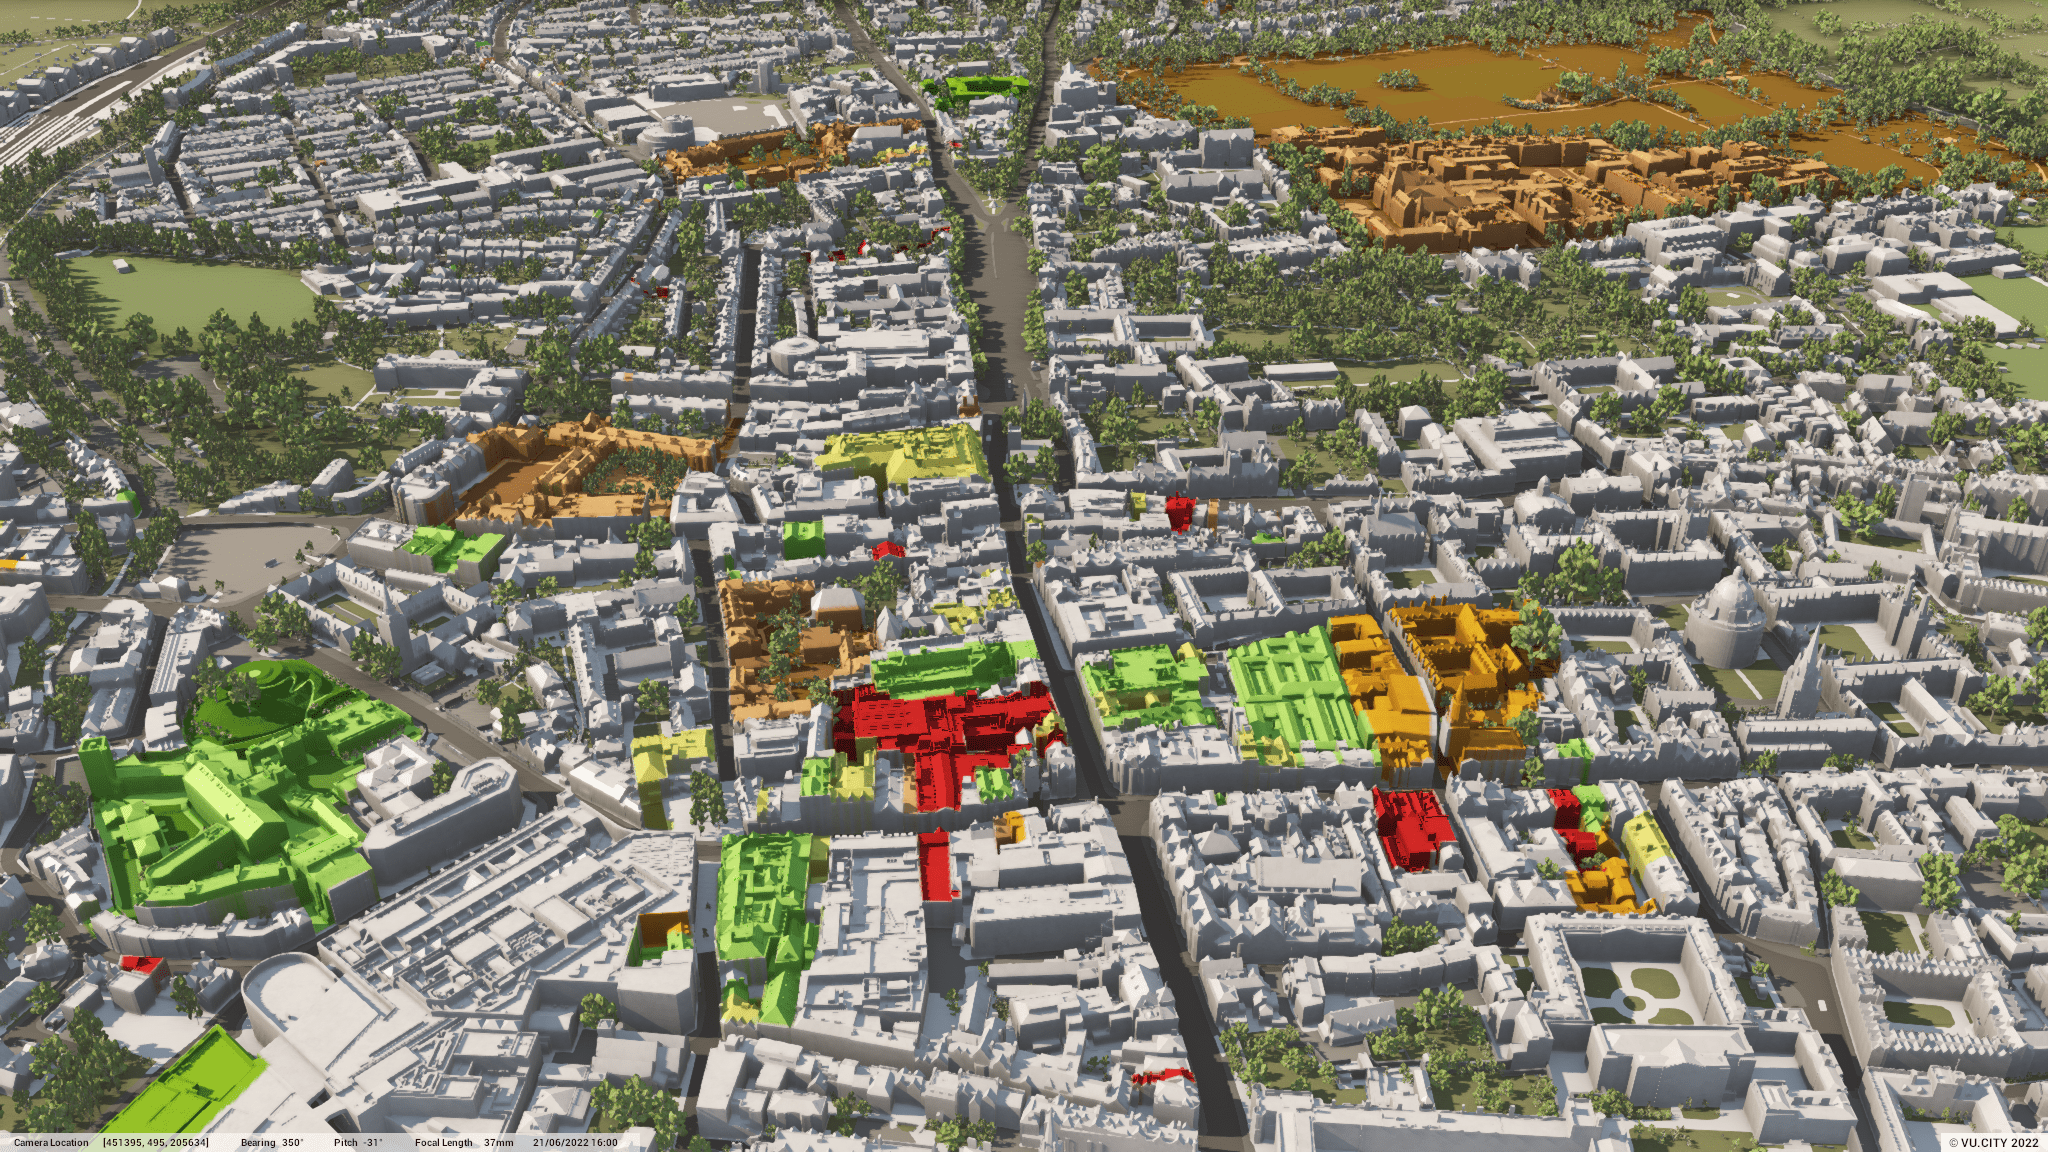
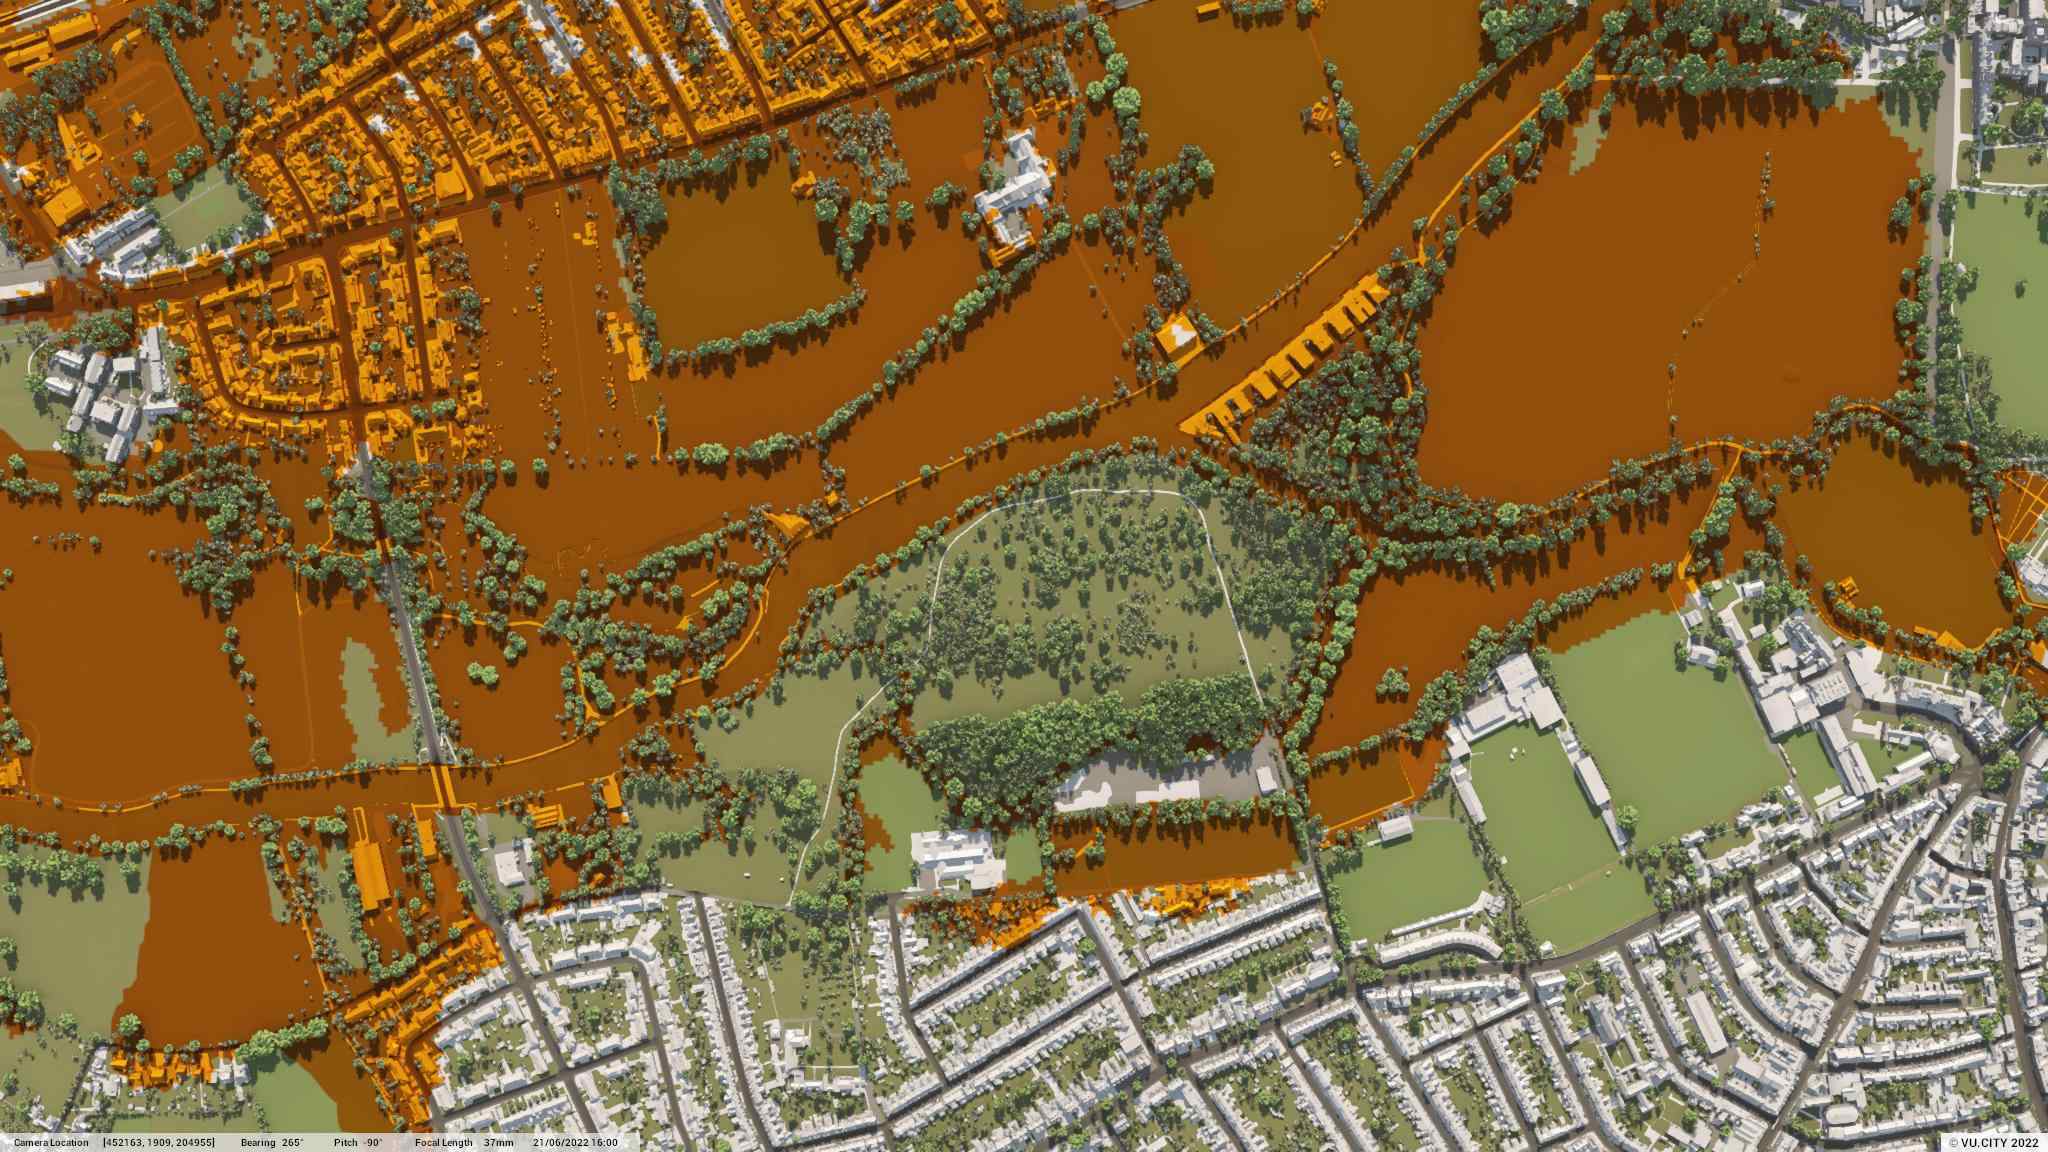
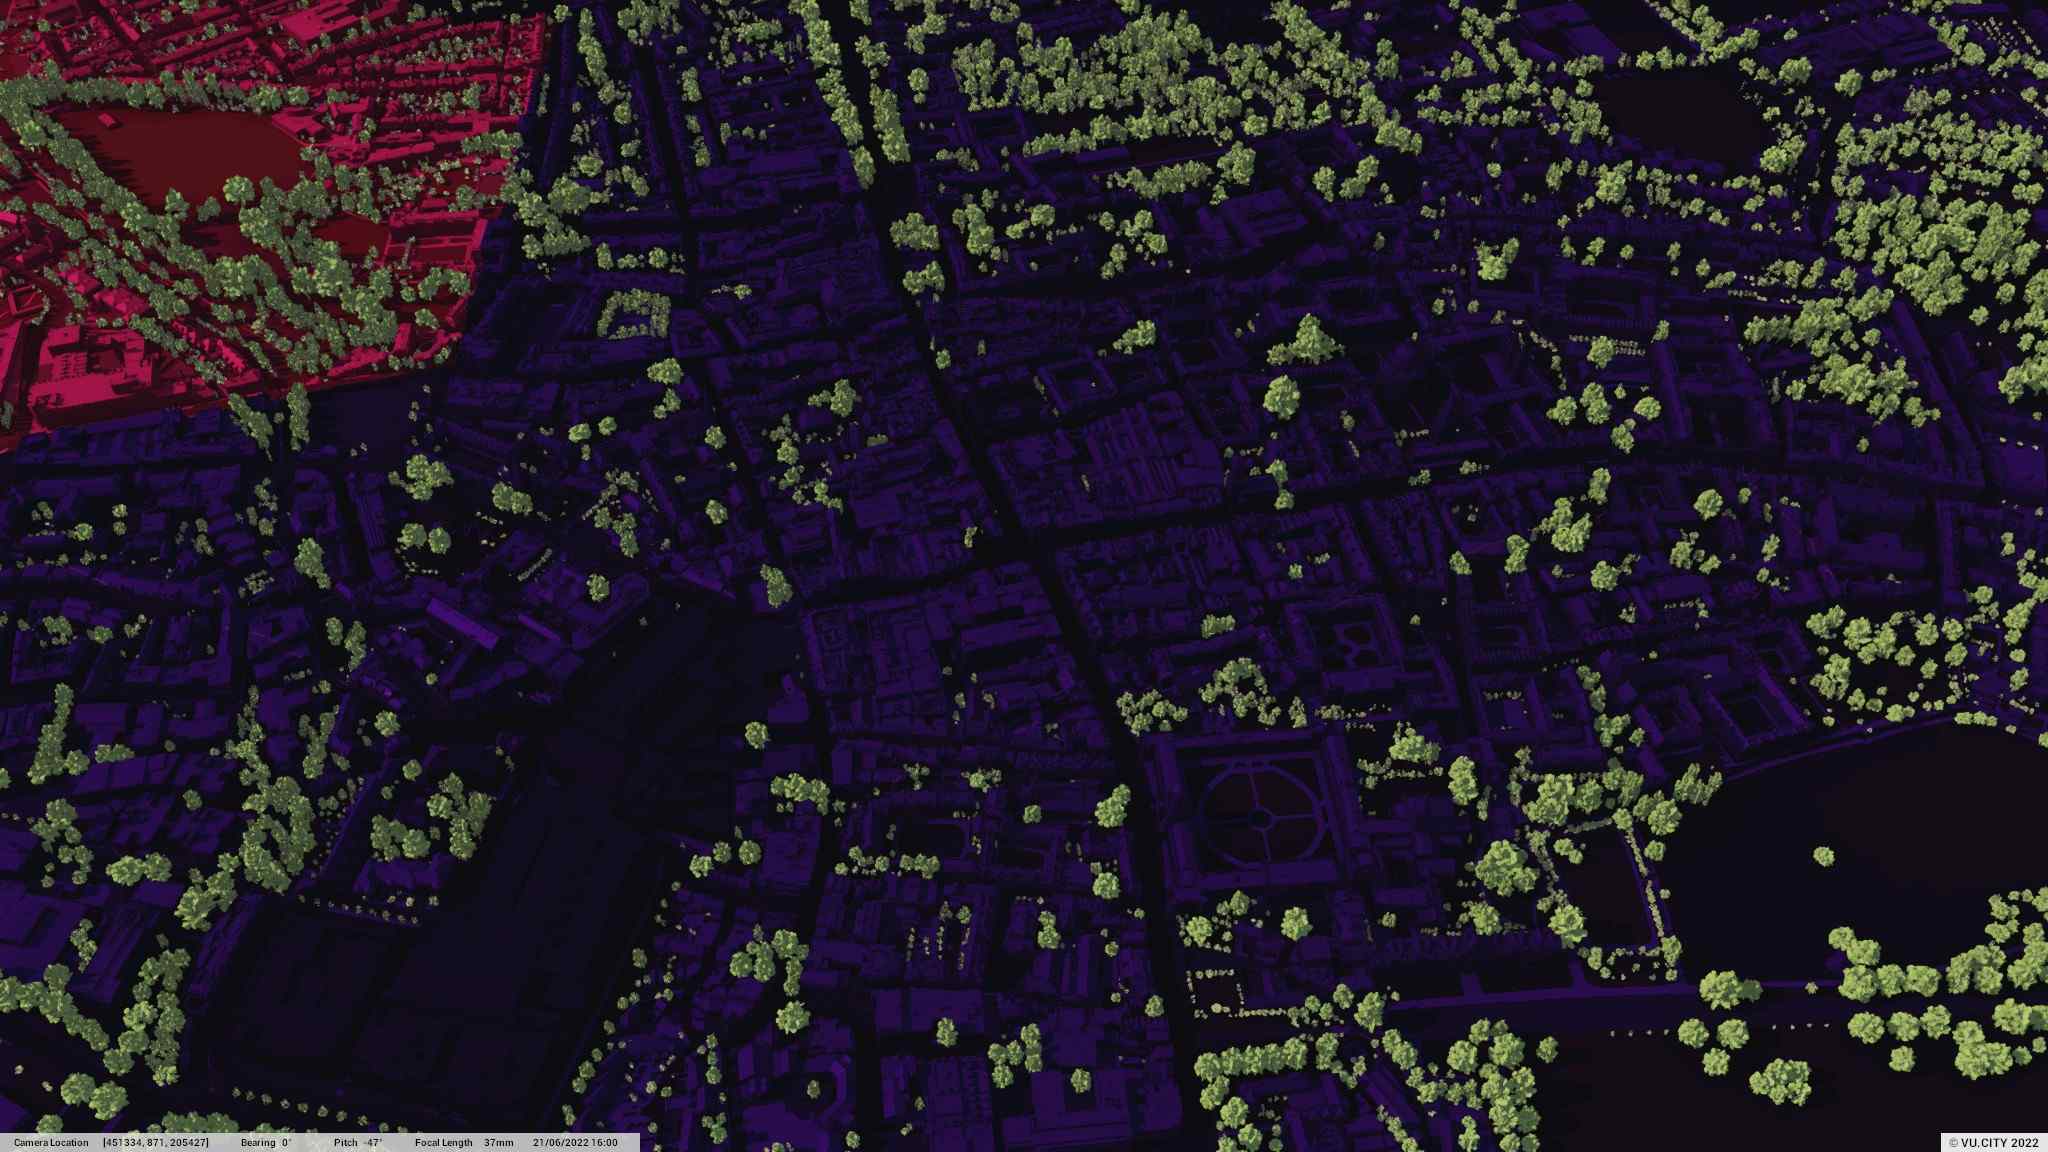
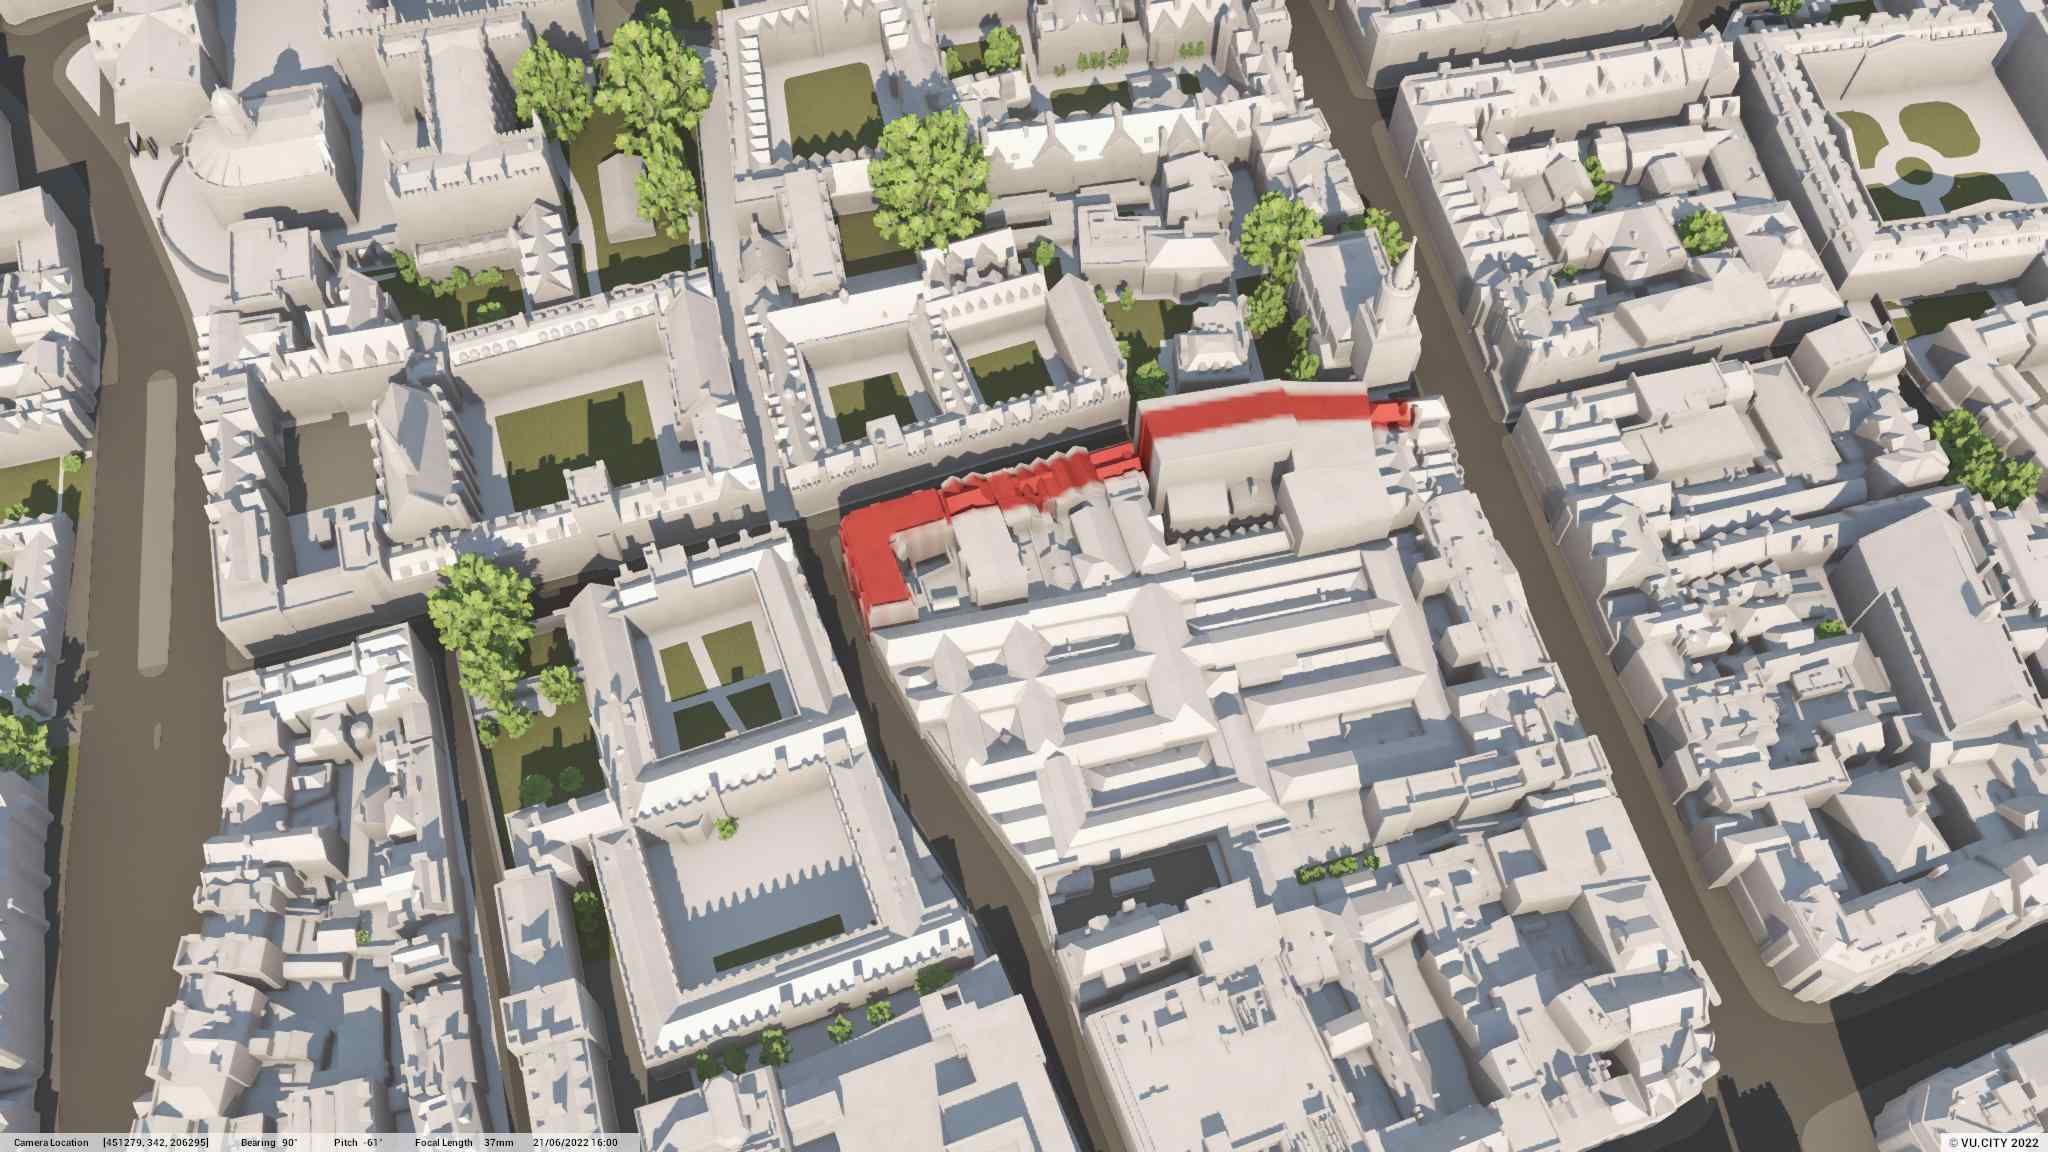
Sunlight Analysis
Quickly view and assess the initial impact of light from your proposed developments.

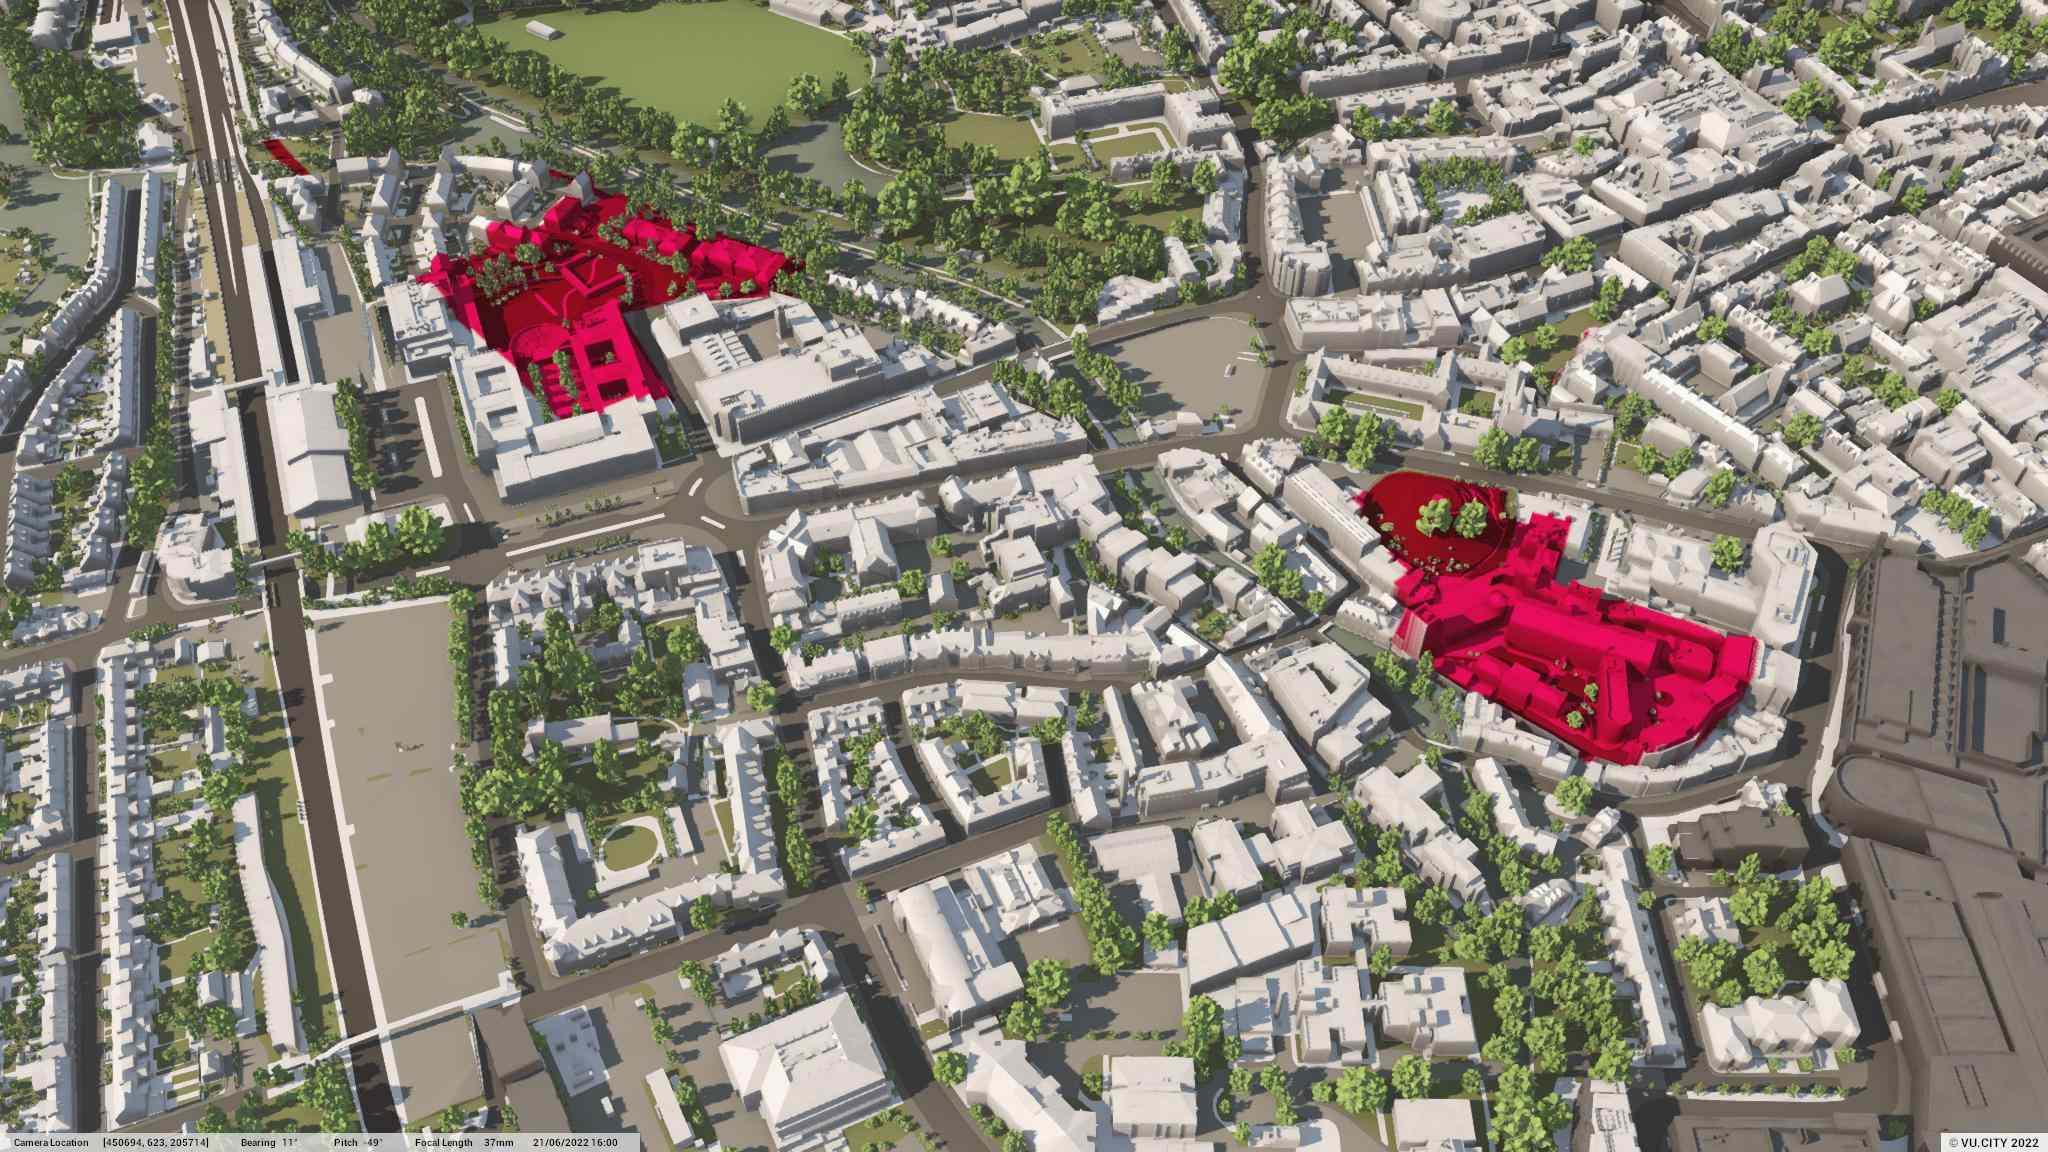
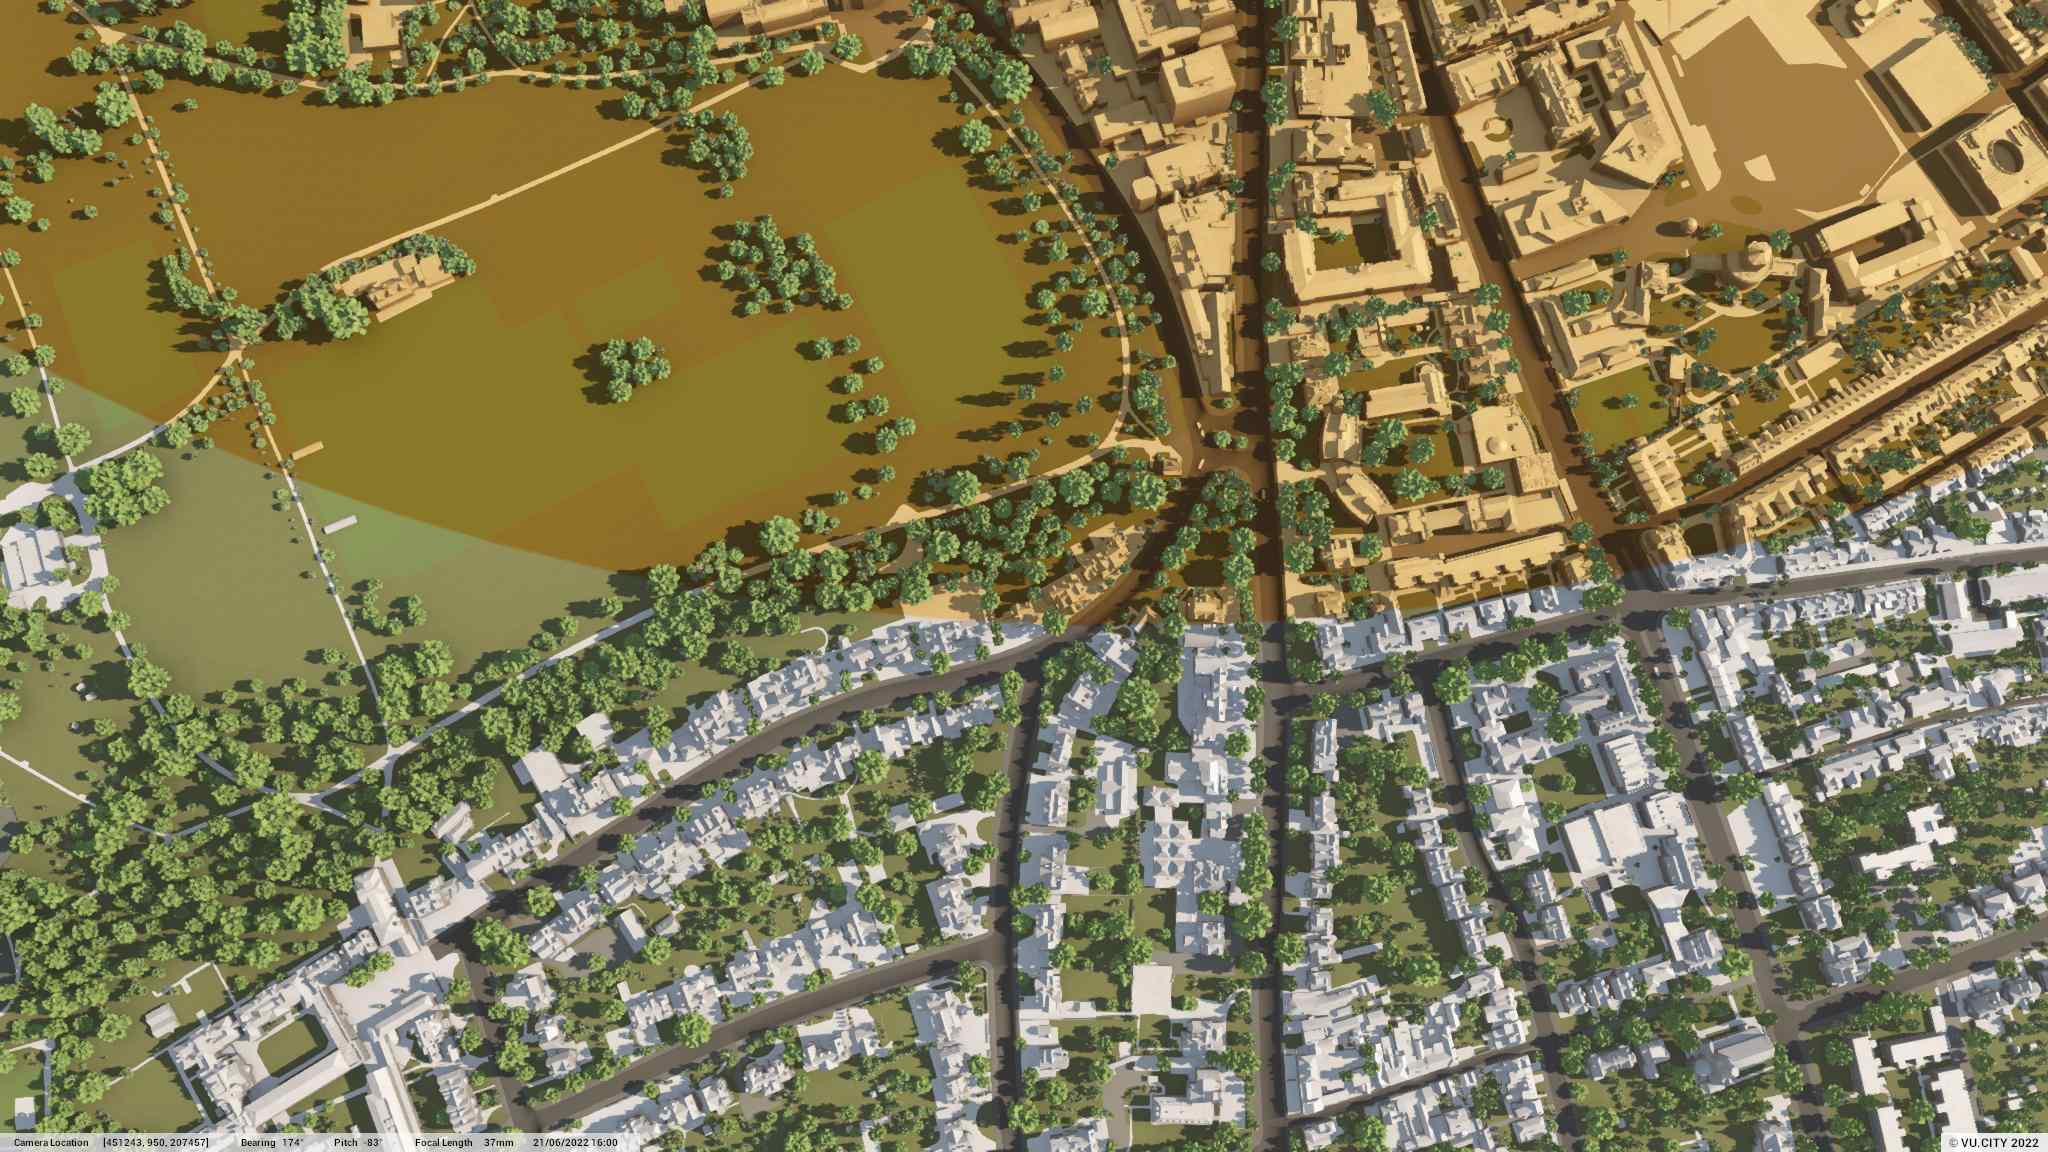
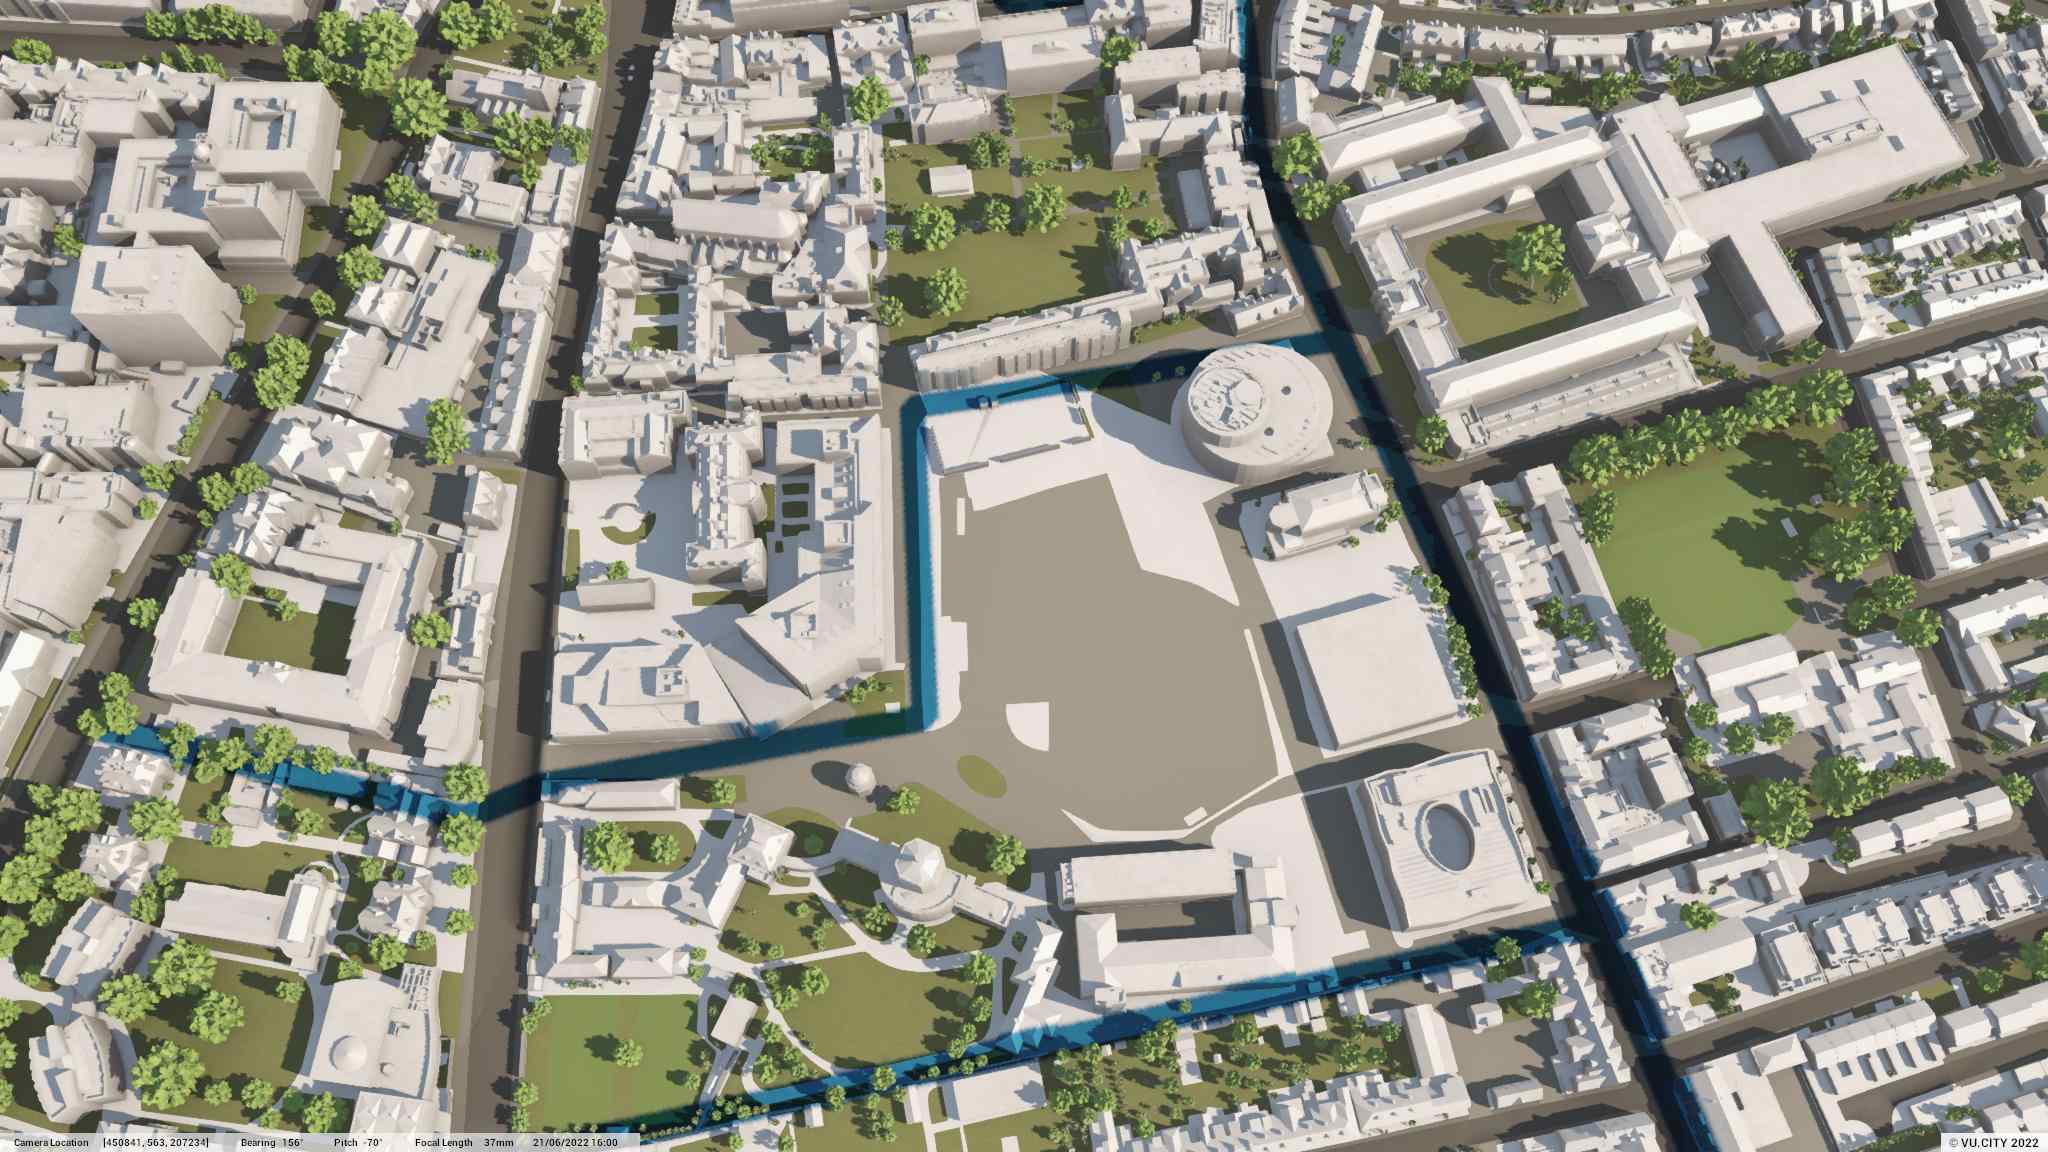
Camera Studies and Presenter Tool
Conduct high-level townscape and visual impact assessments. Agree on key views to analyse further. Select key views and confidentially present your proposals to take stakeholder on the journey of design.

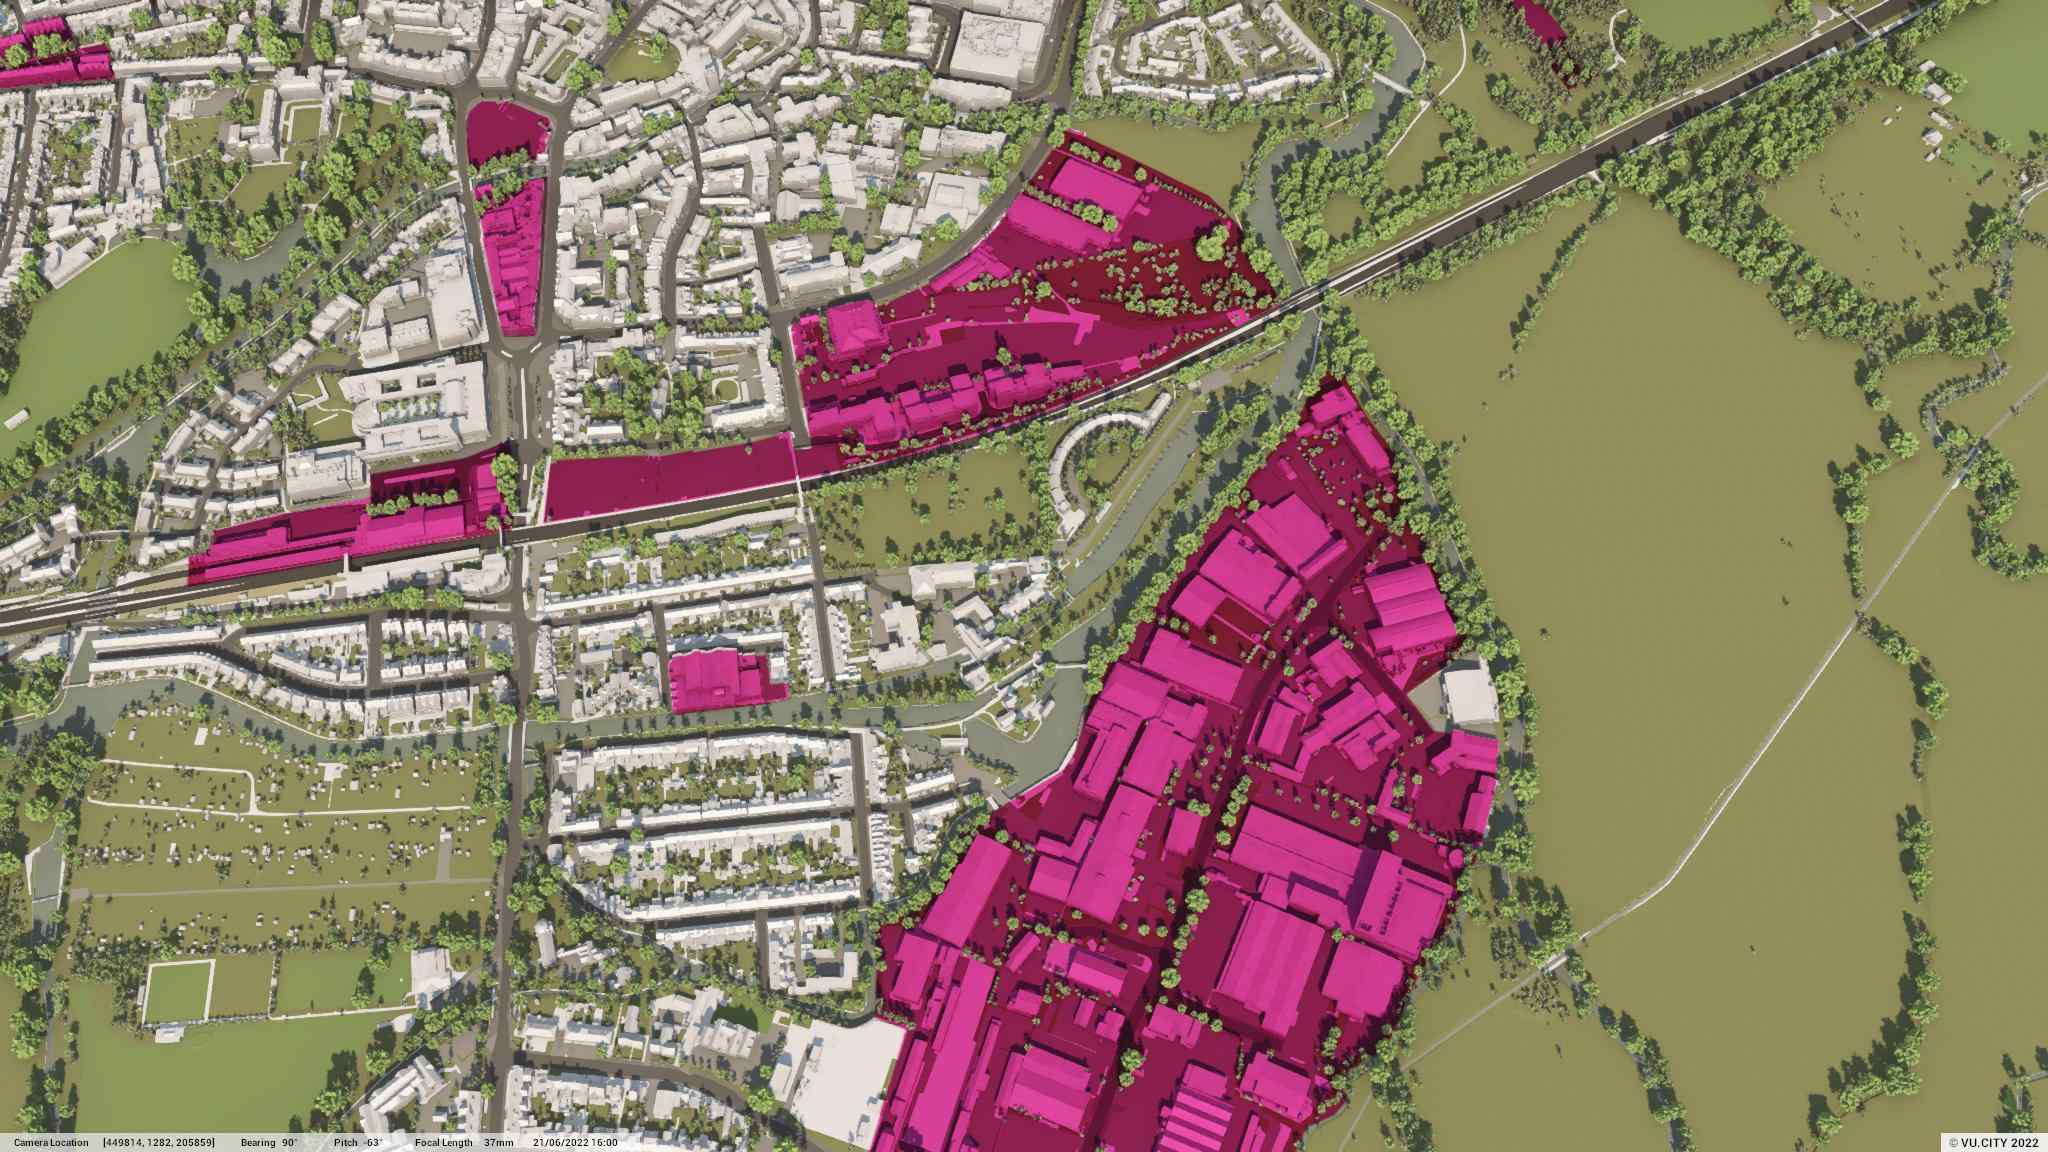
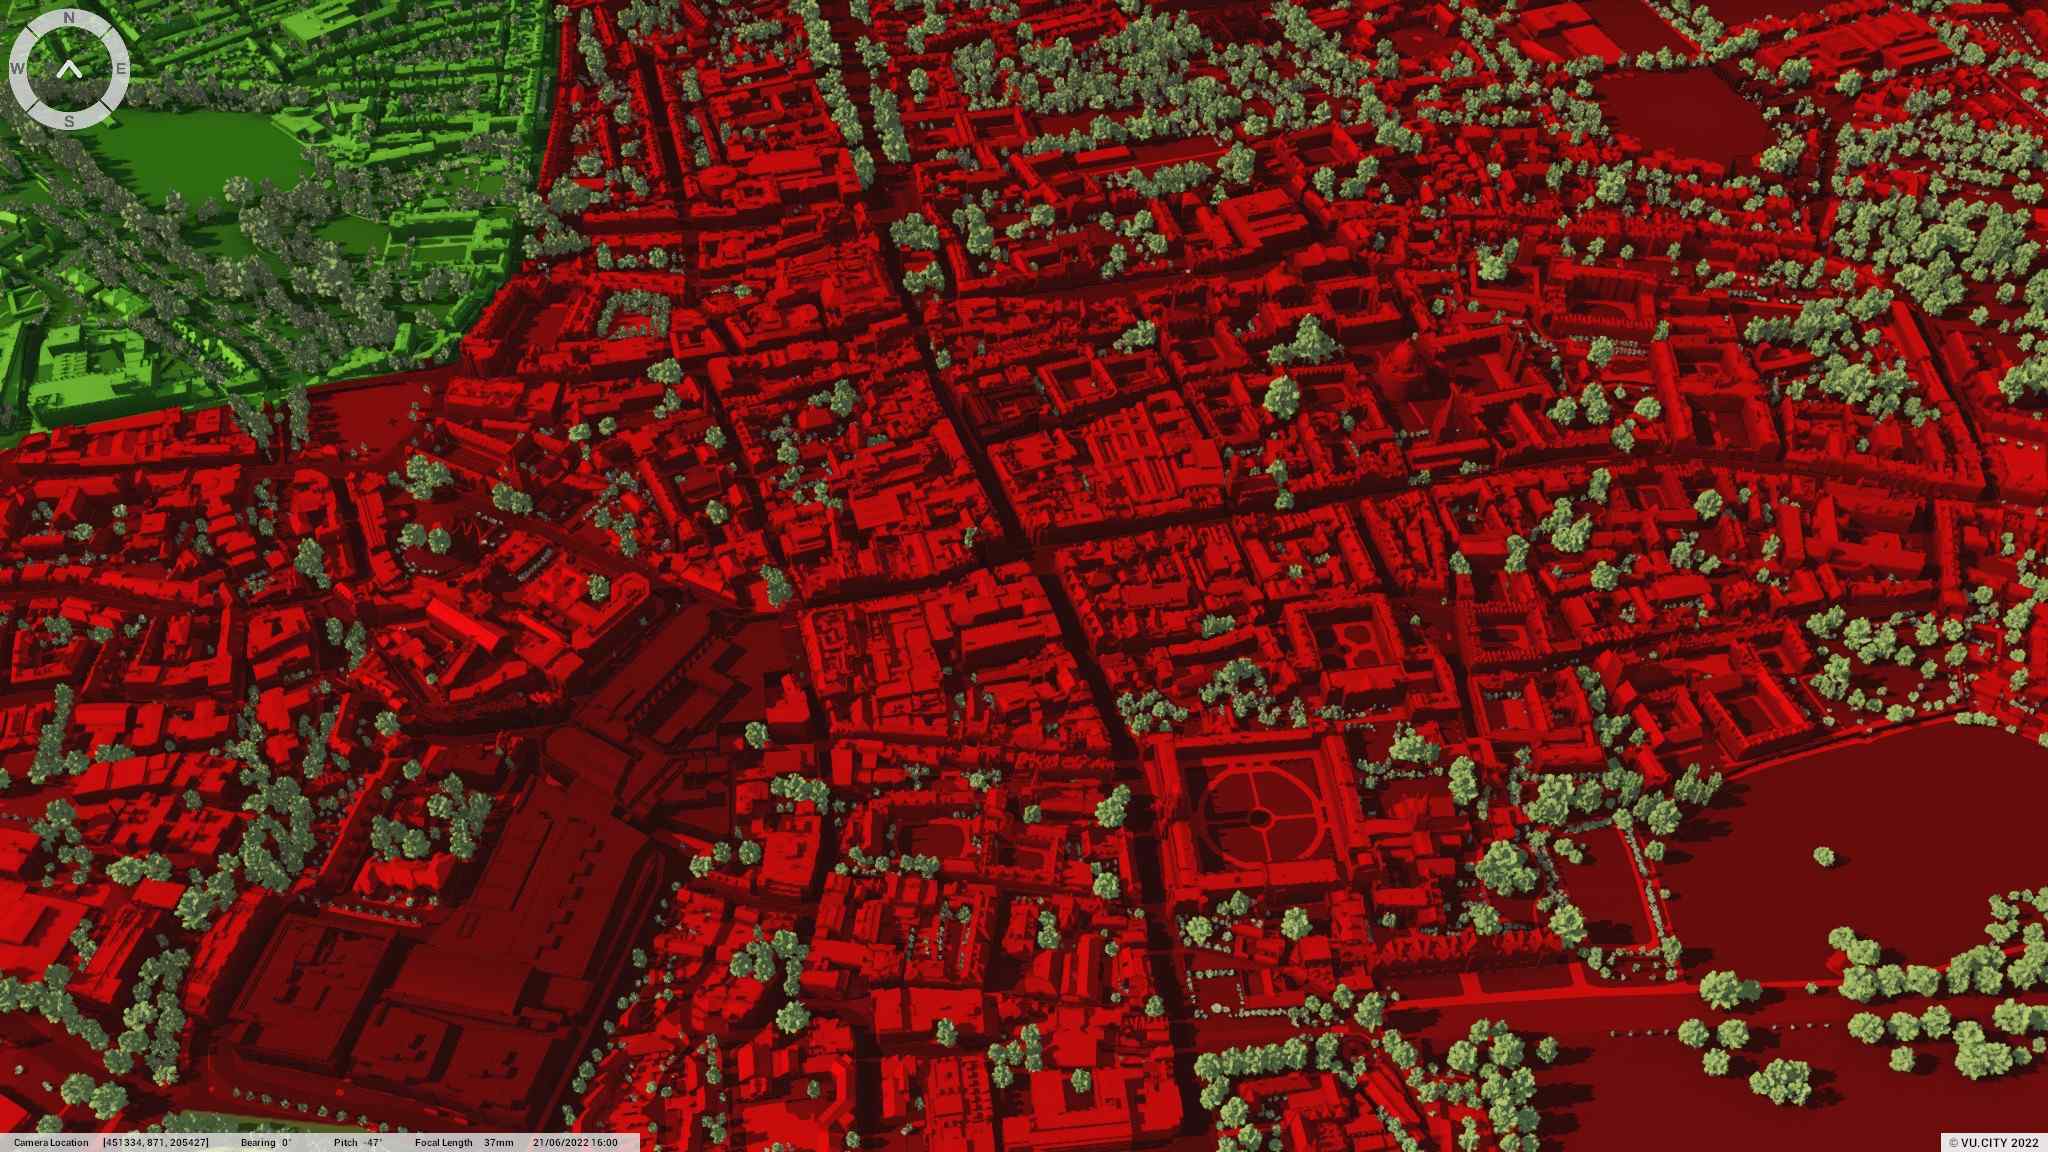
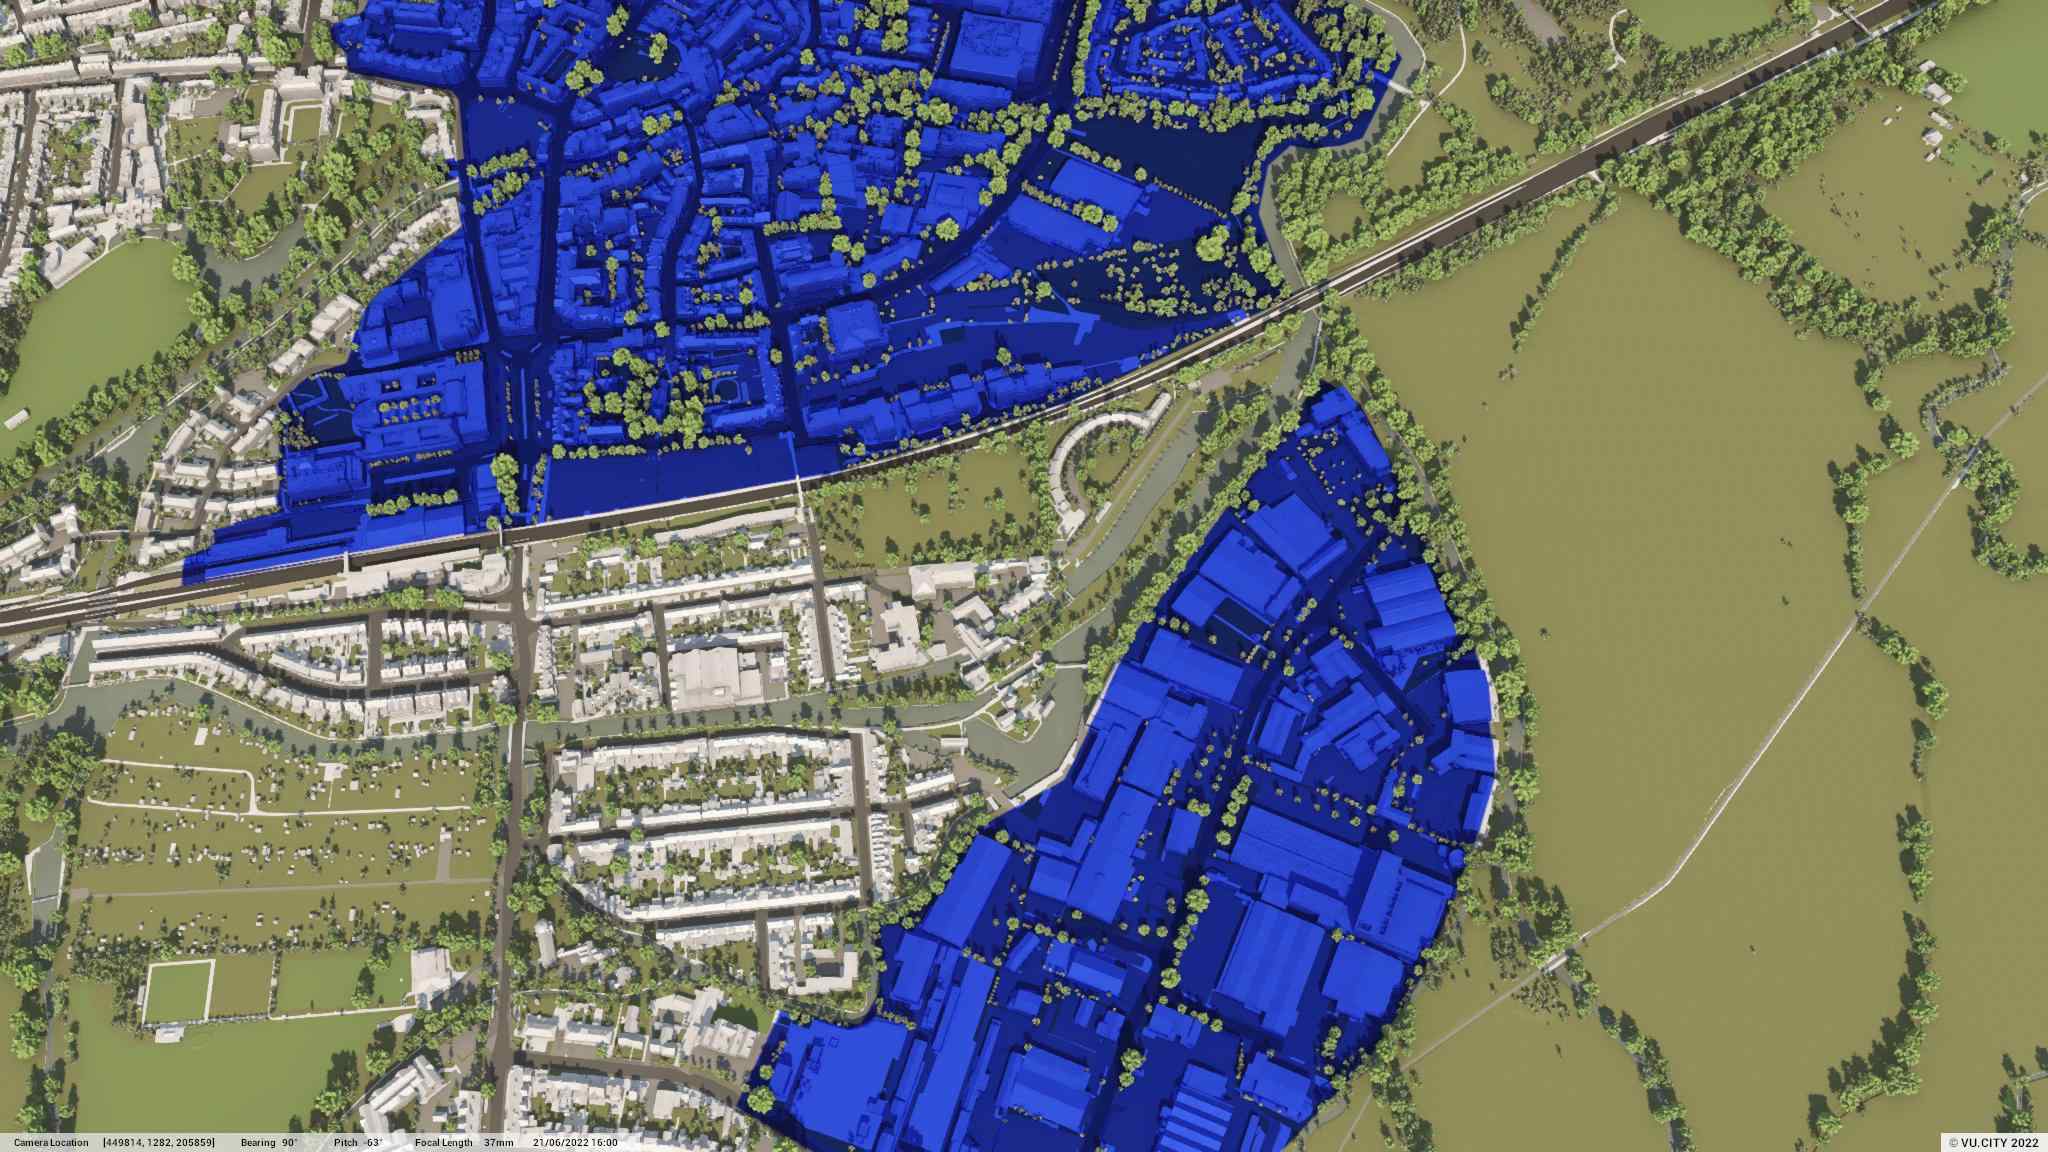
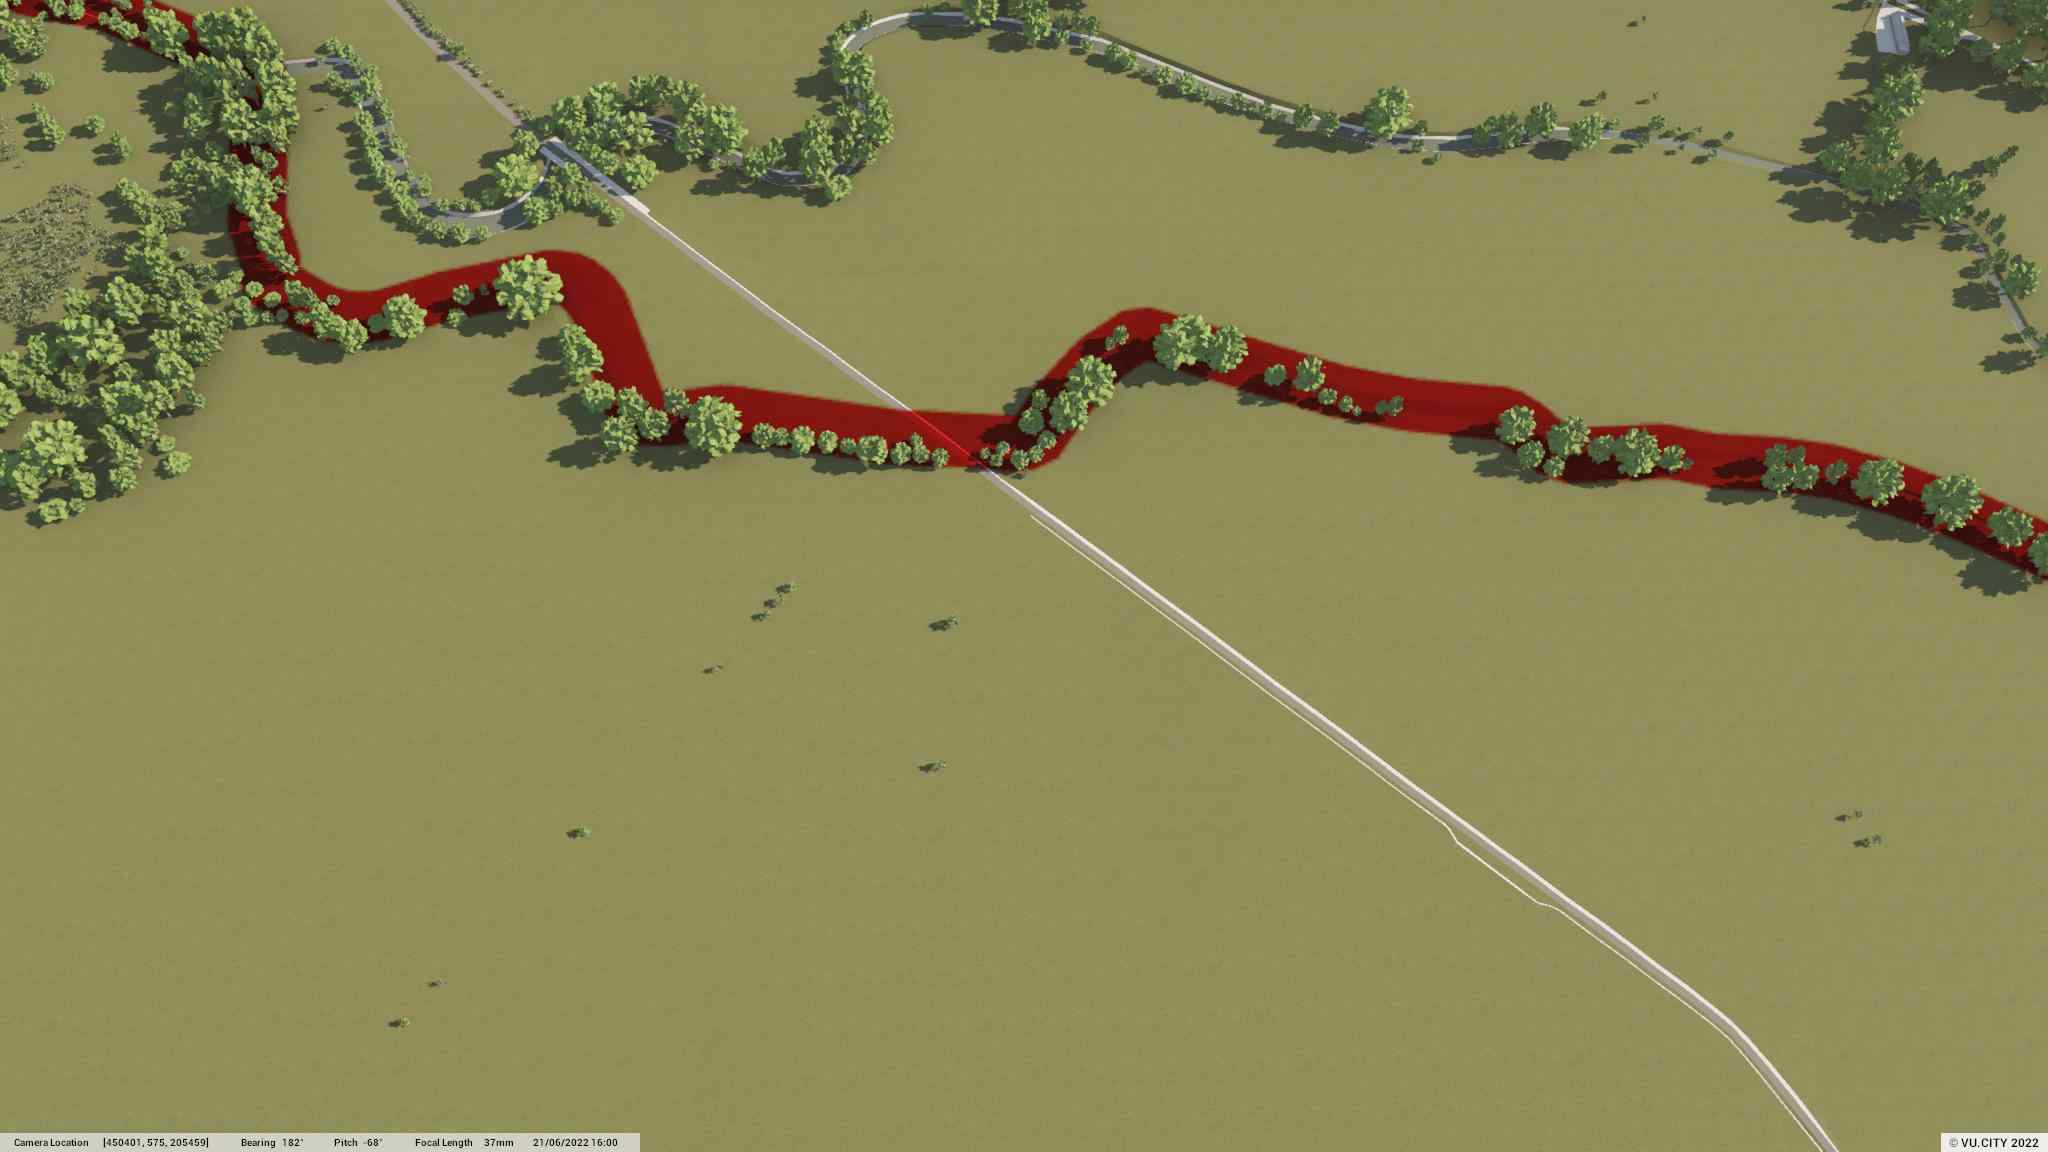
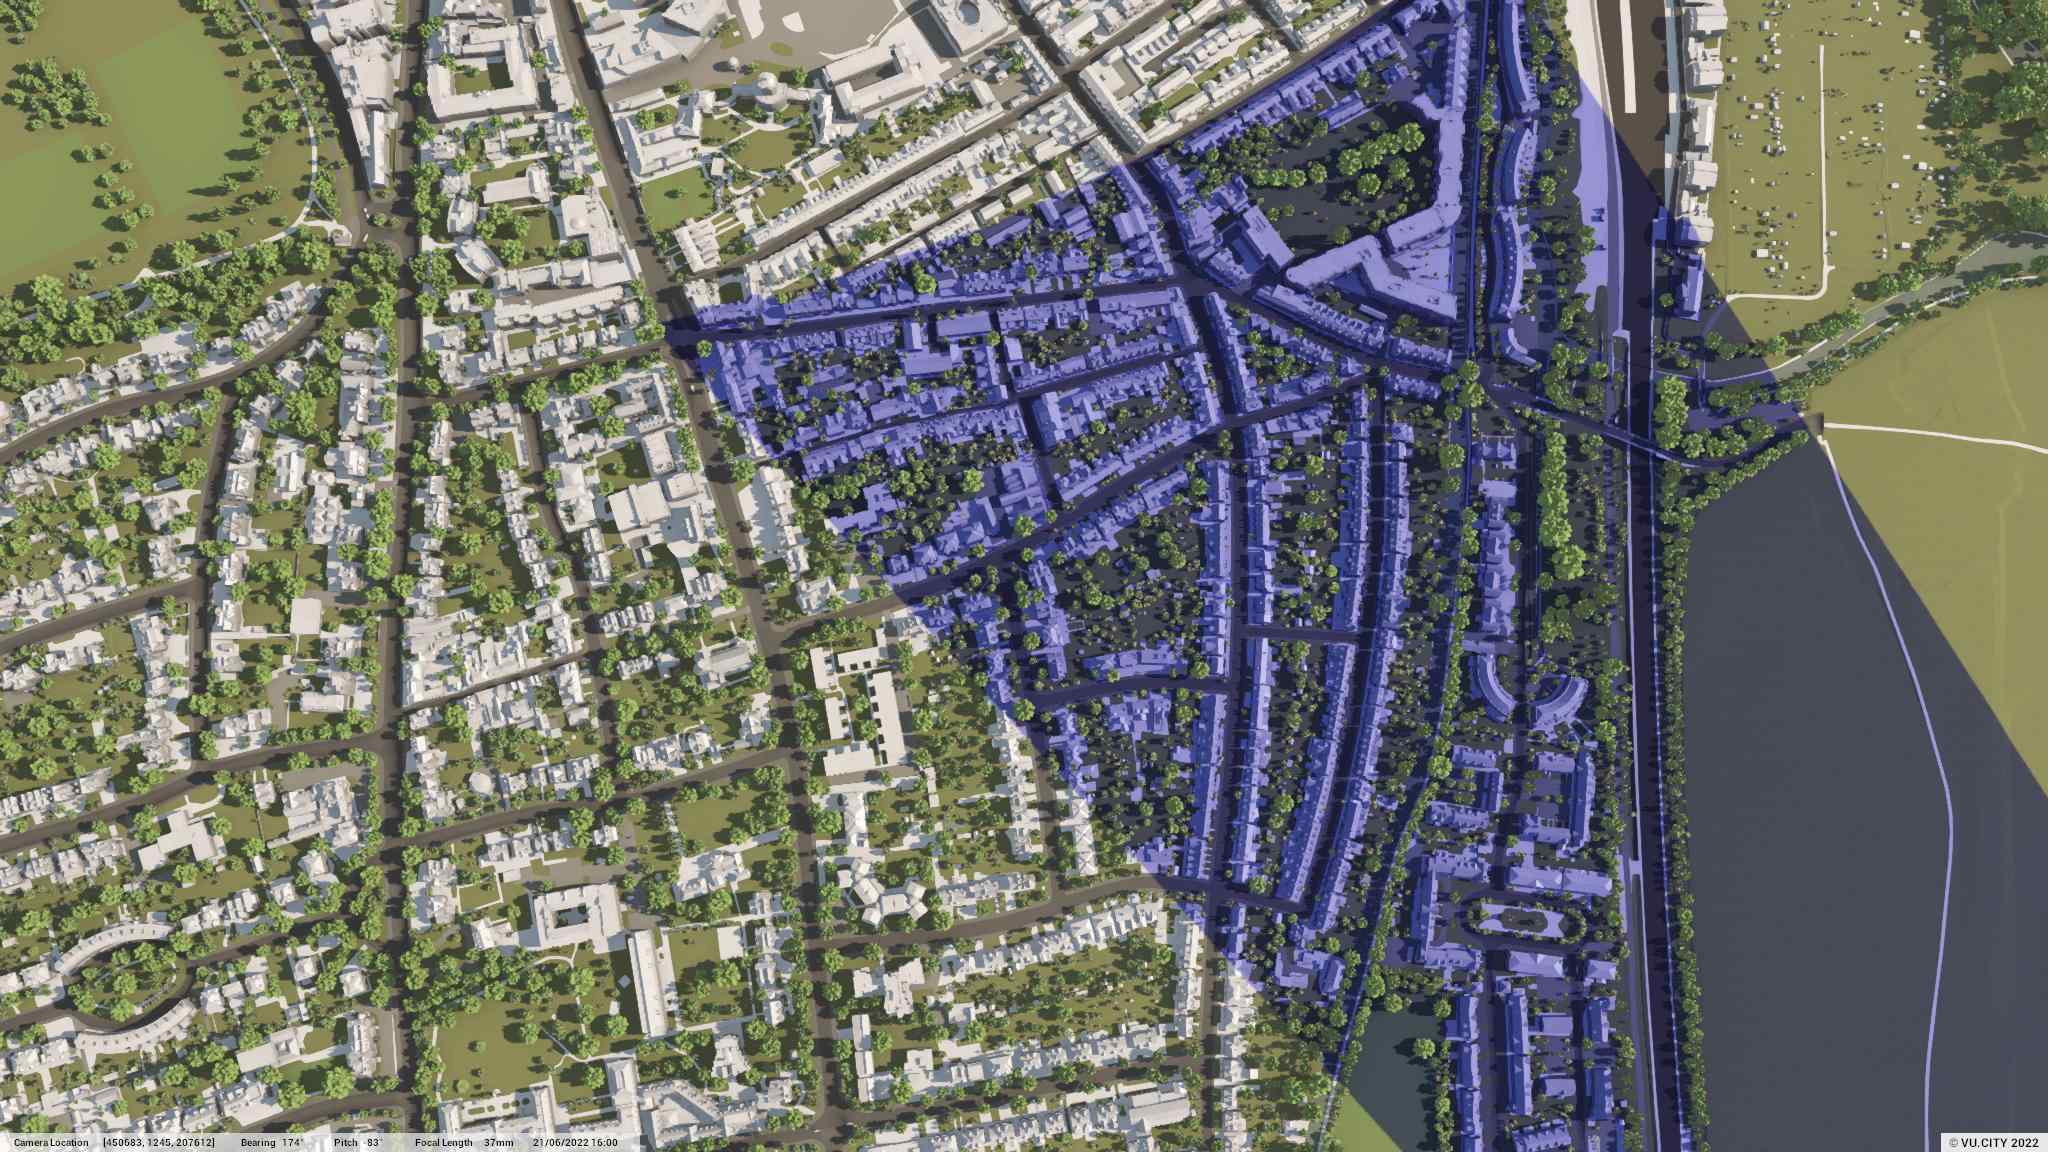
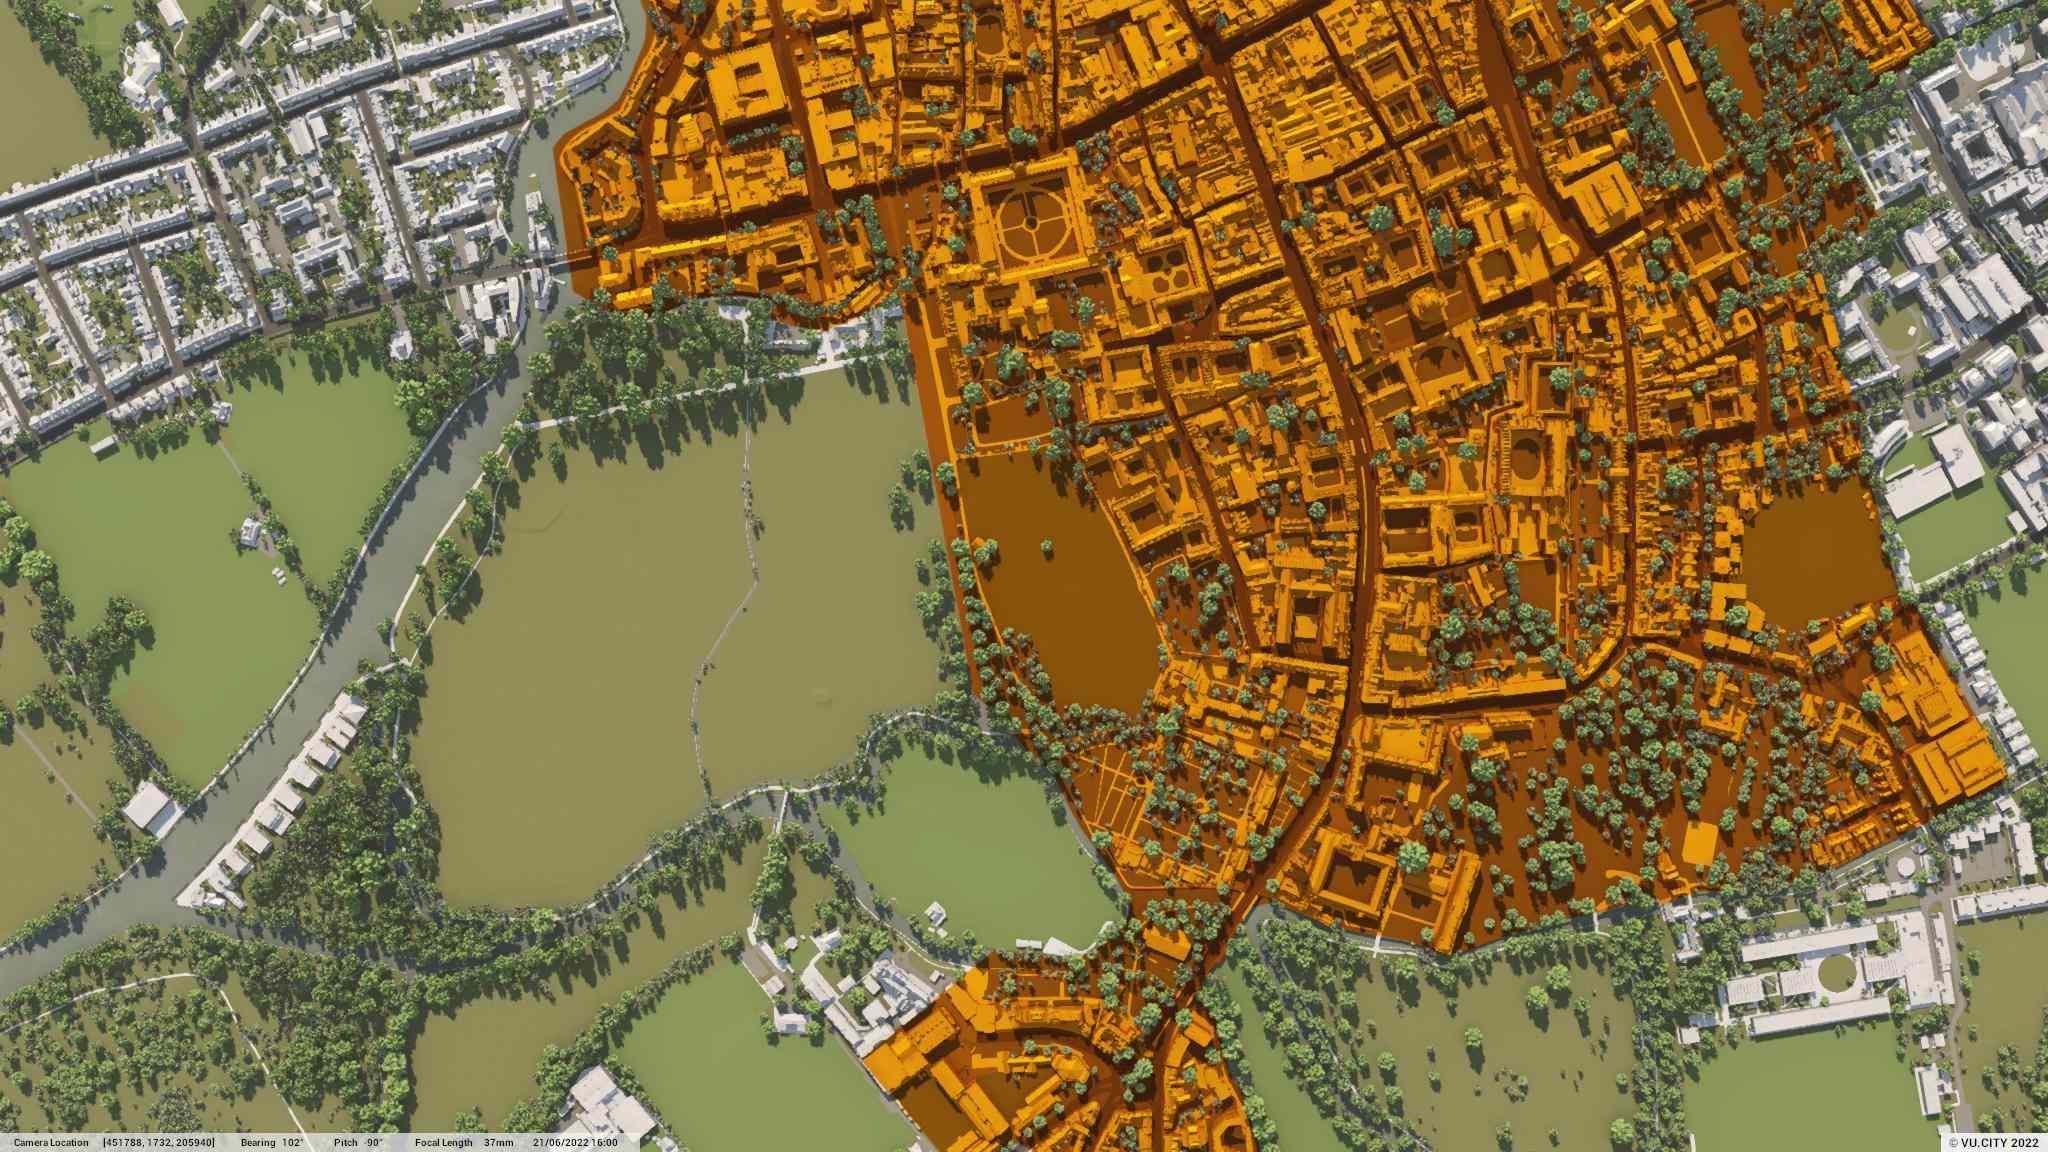
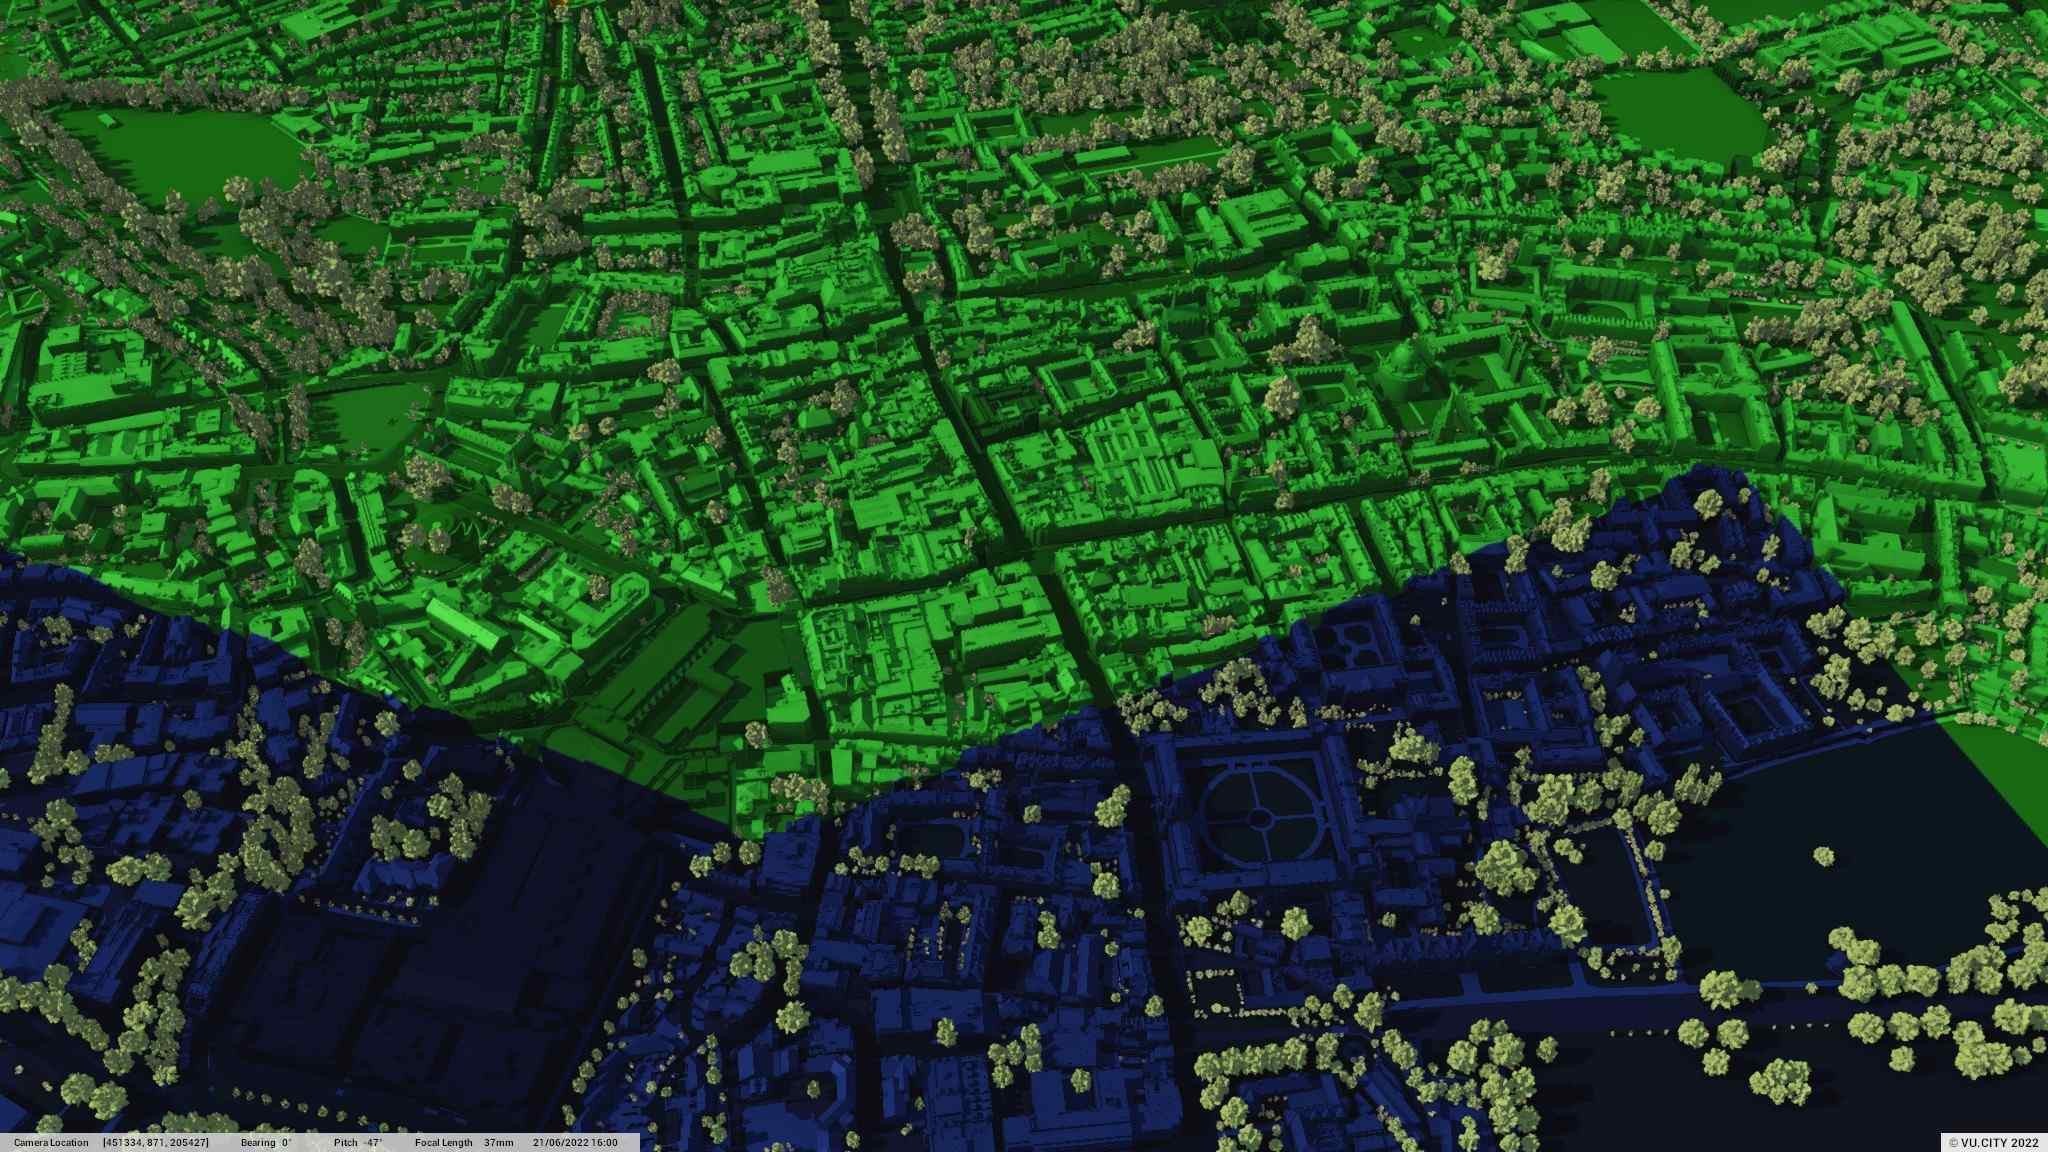
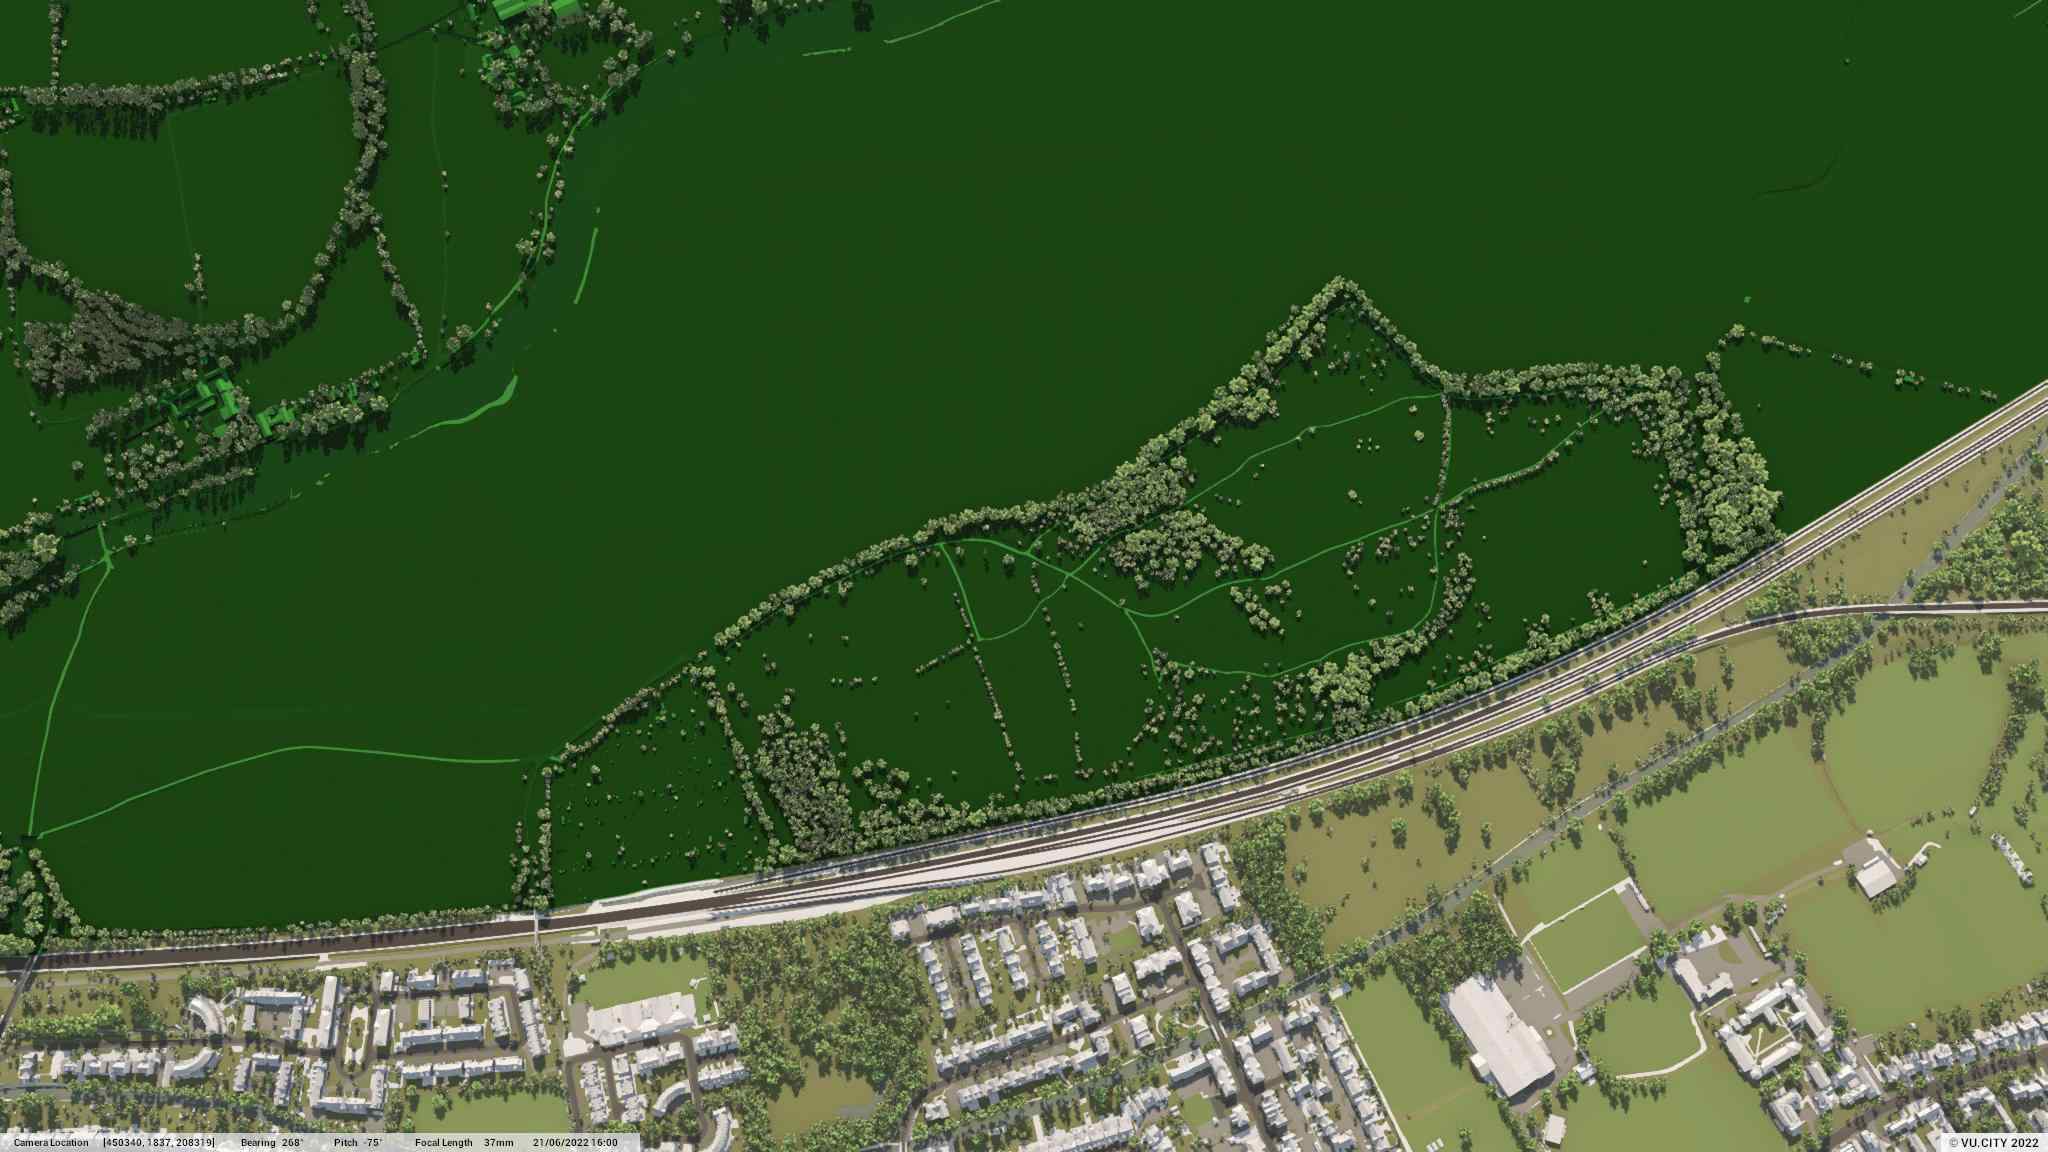
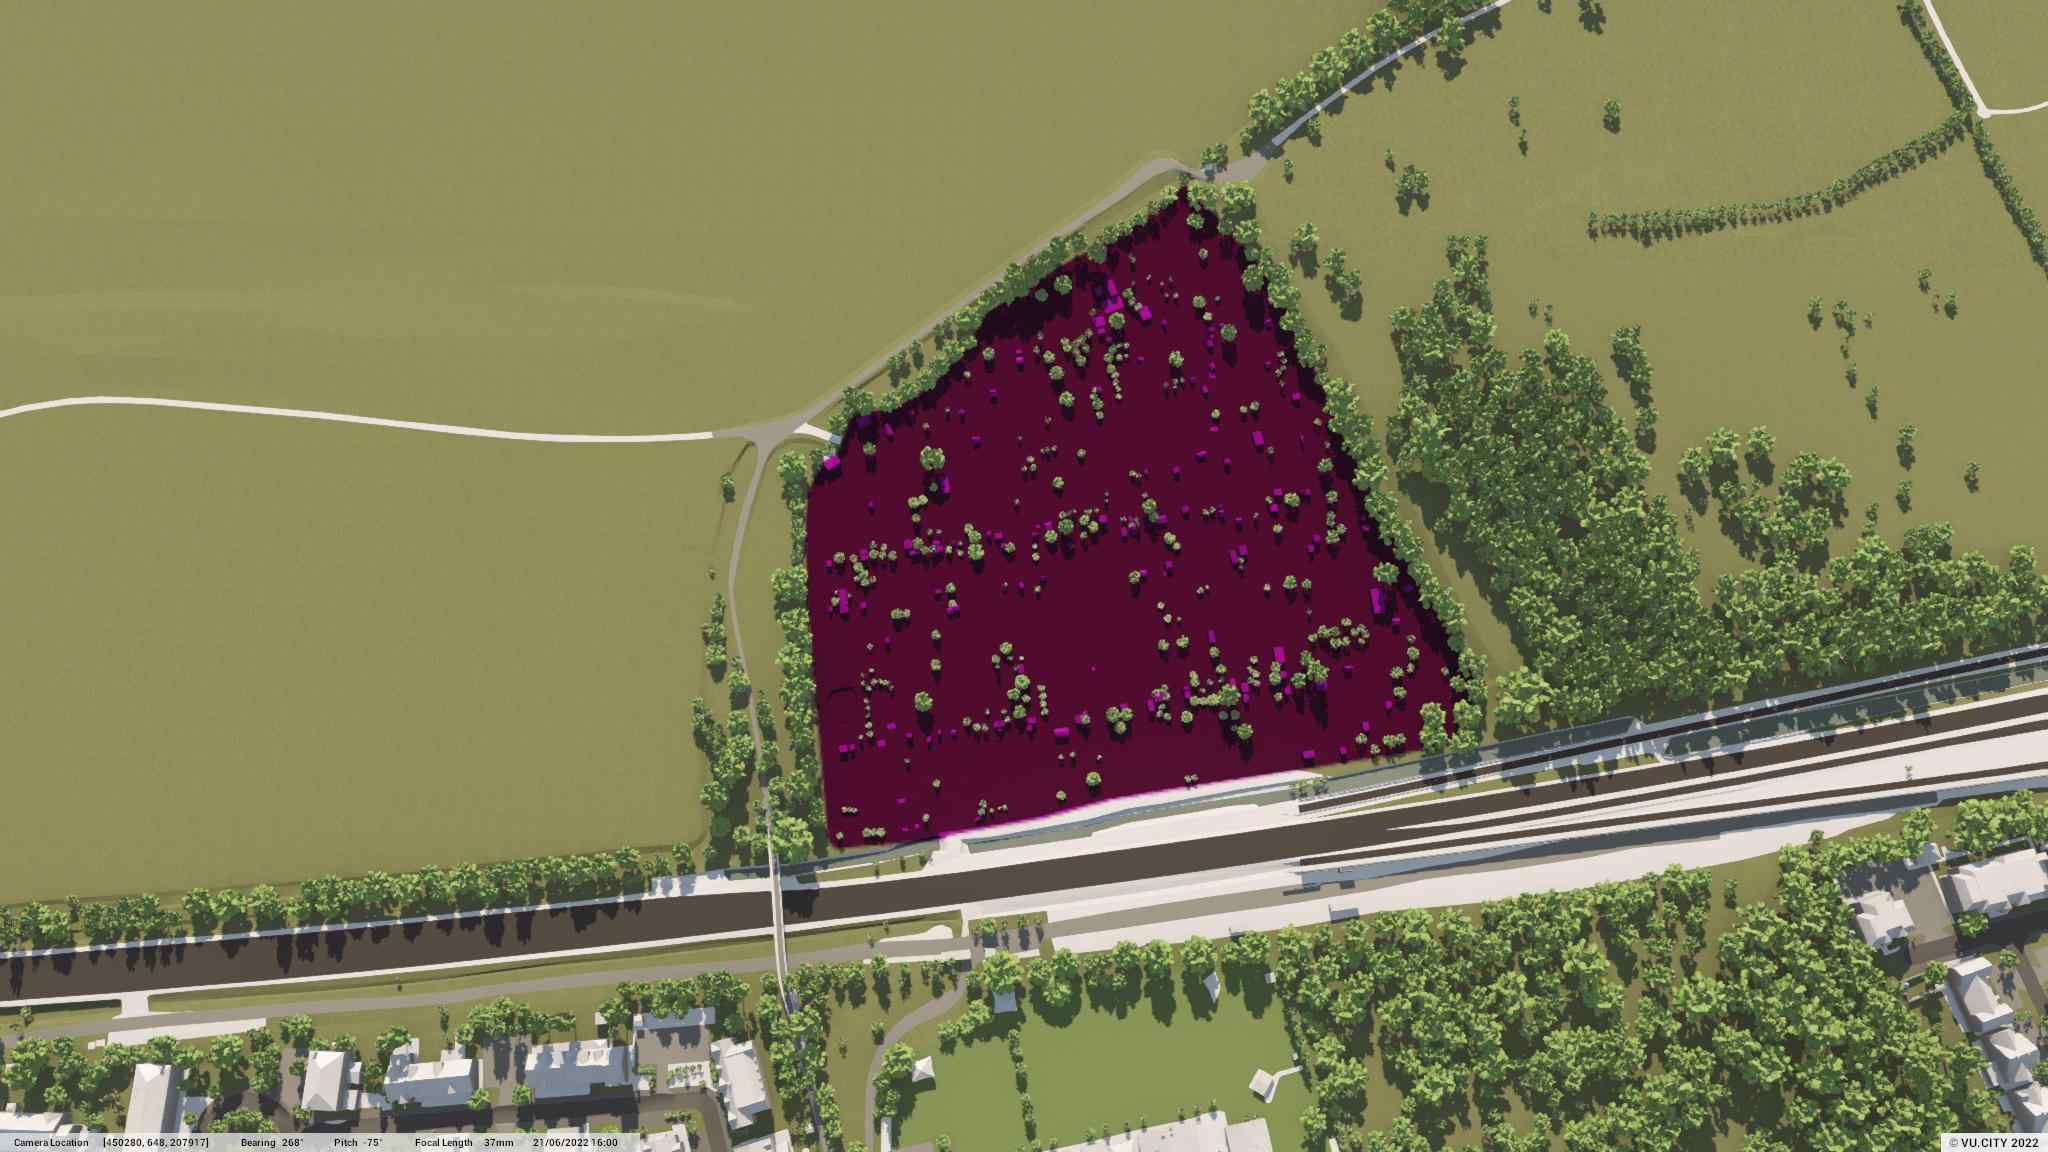
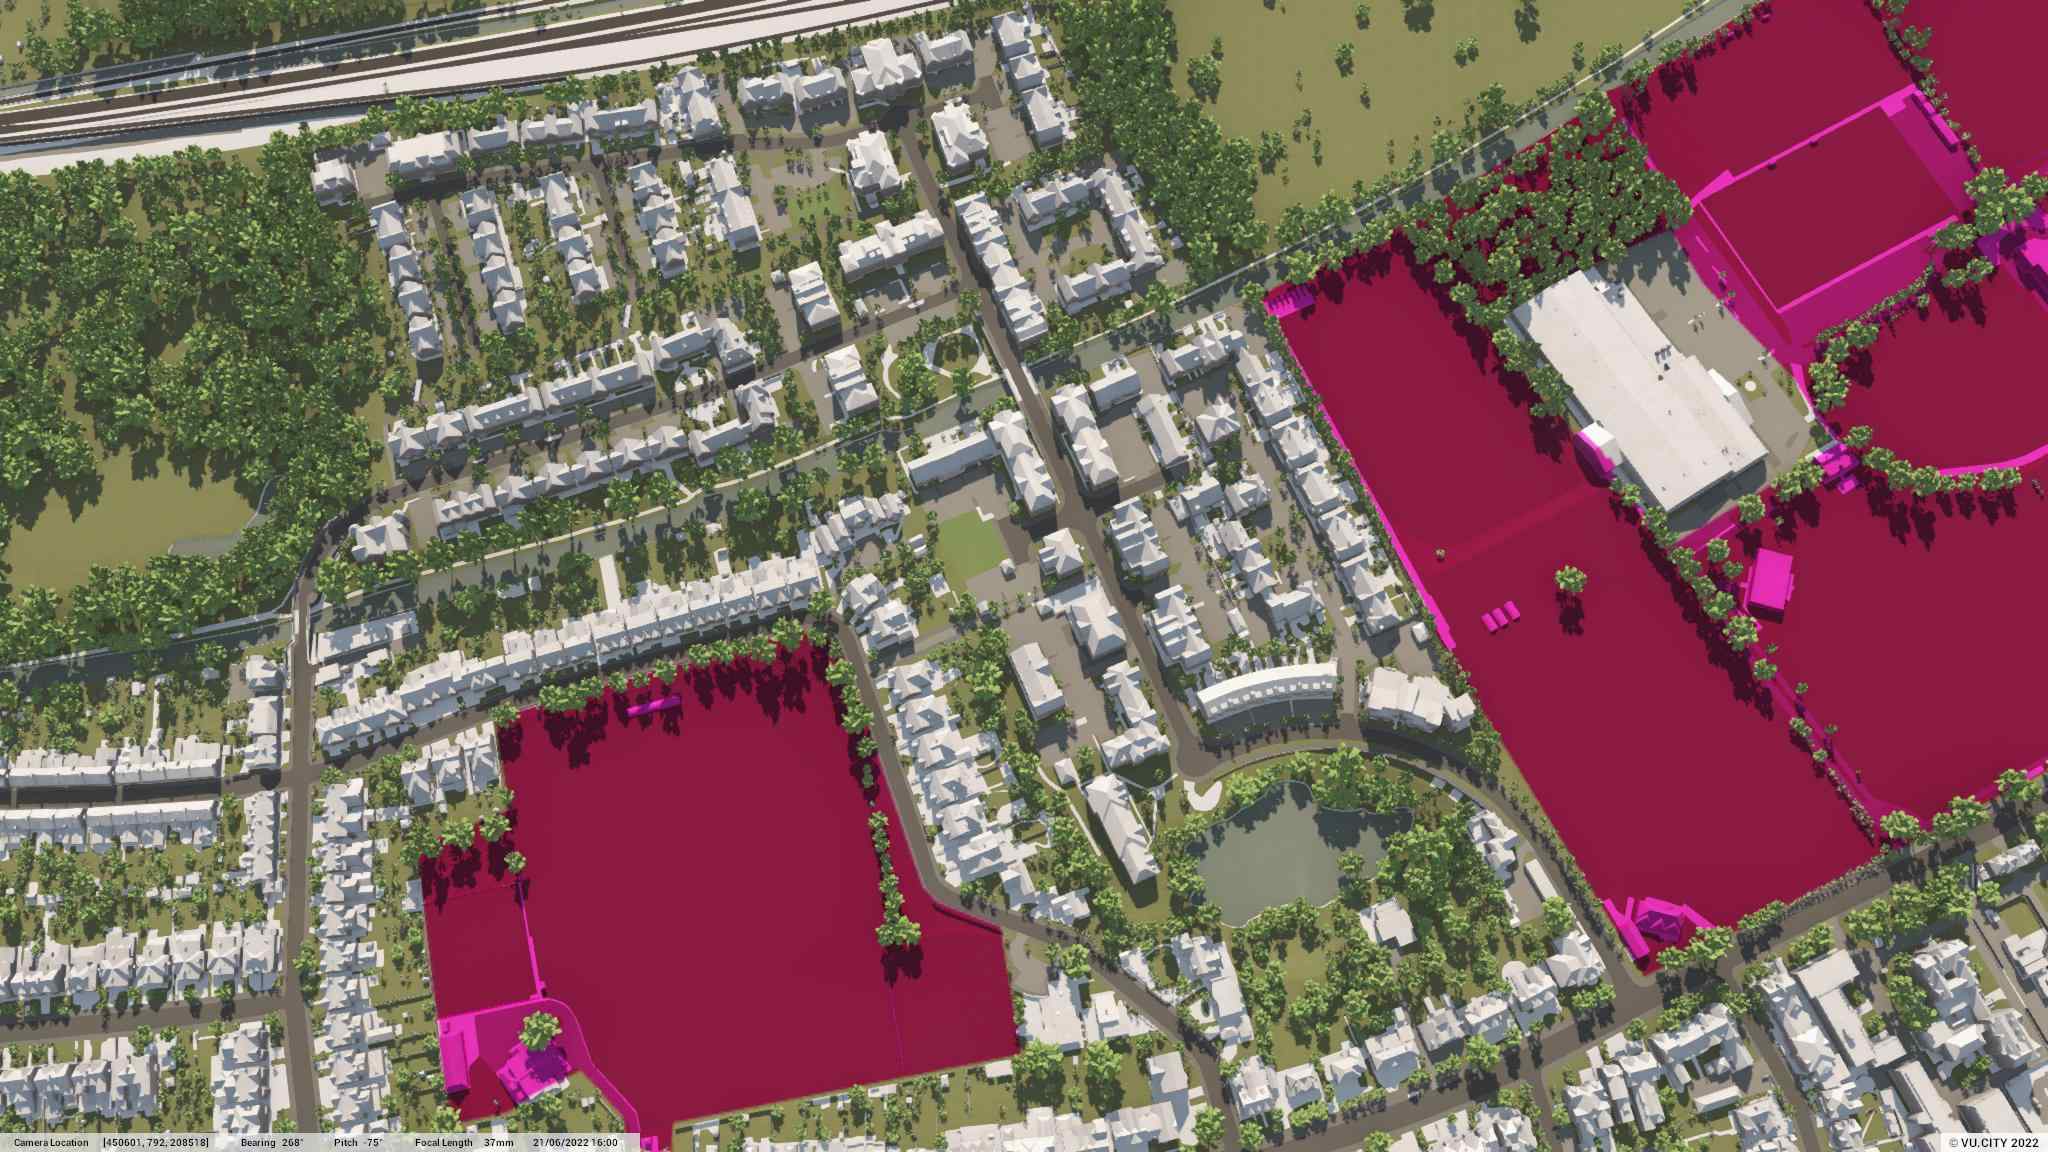
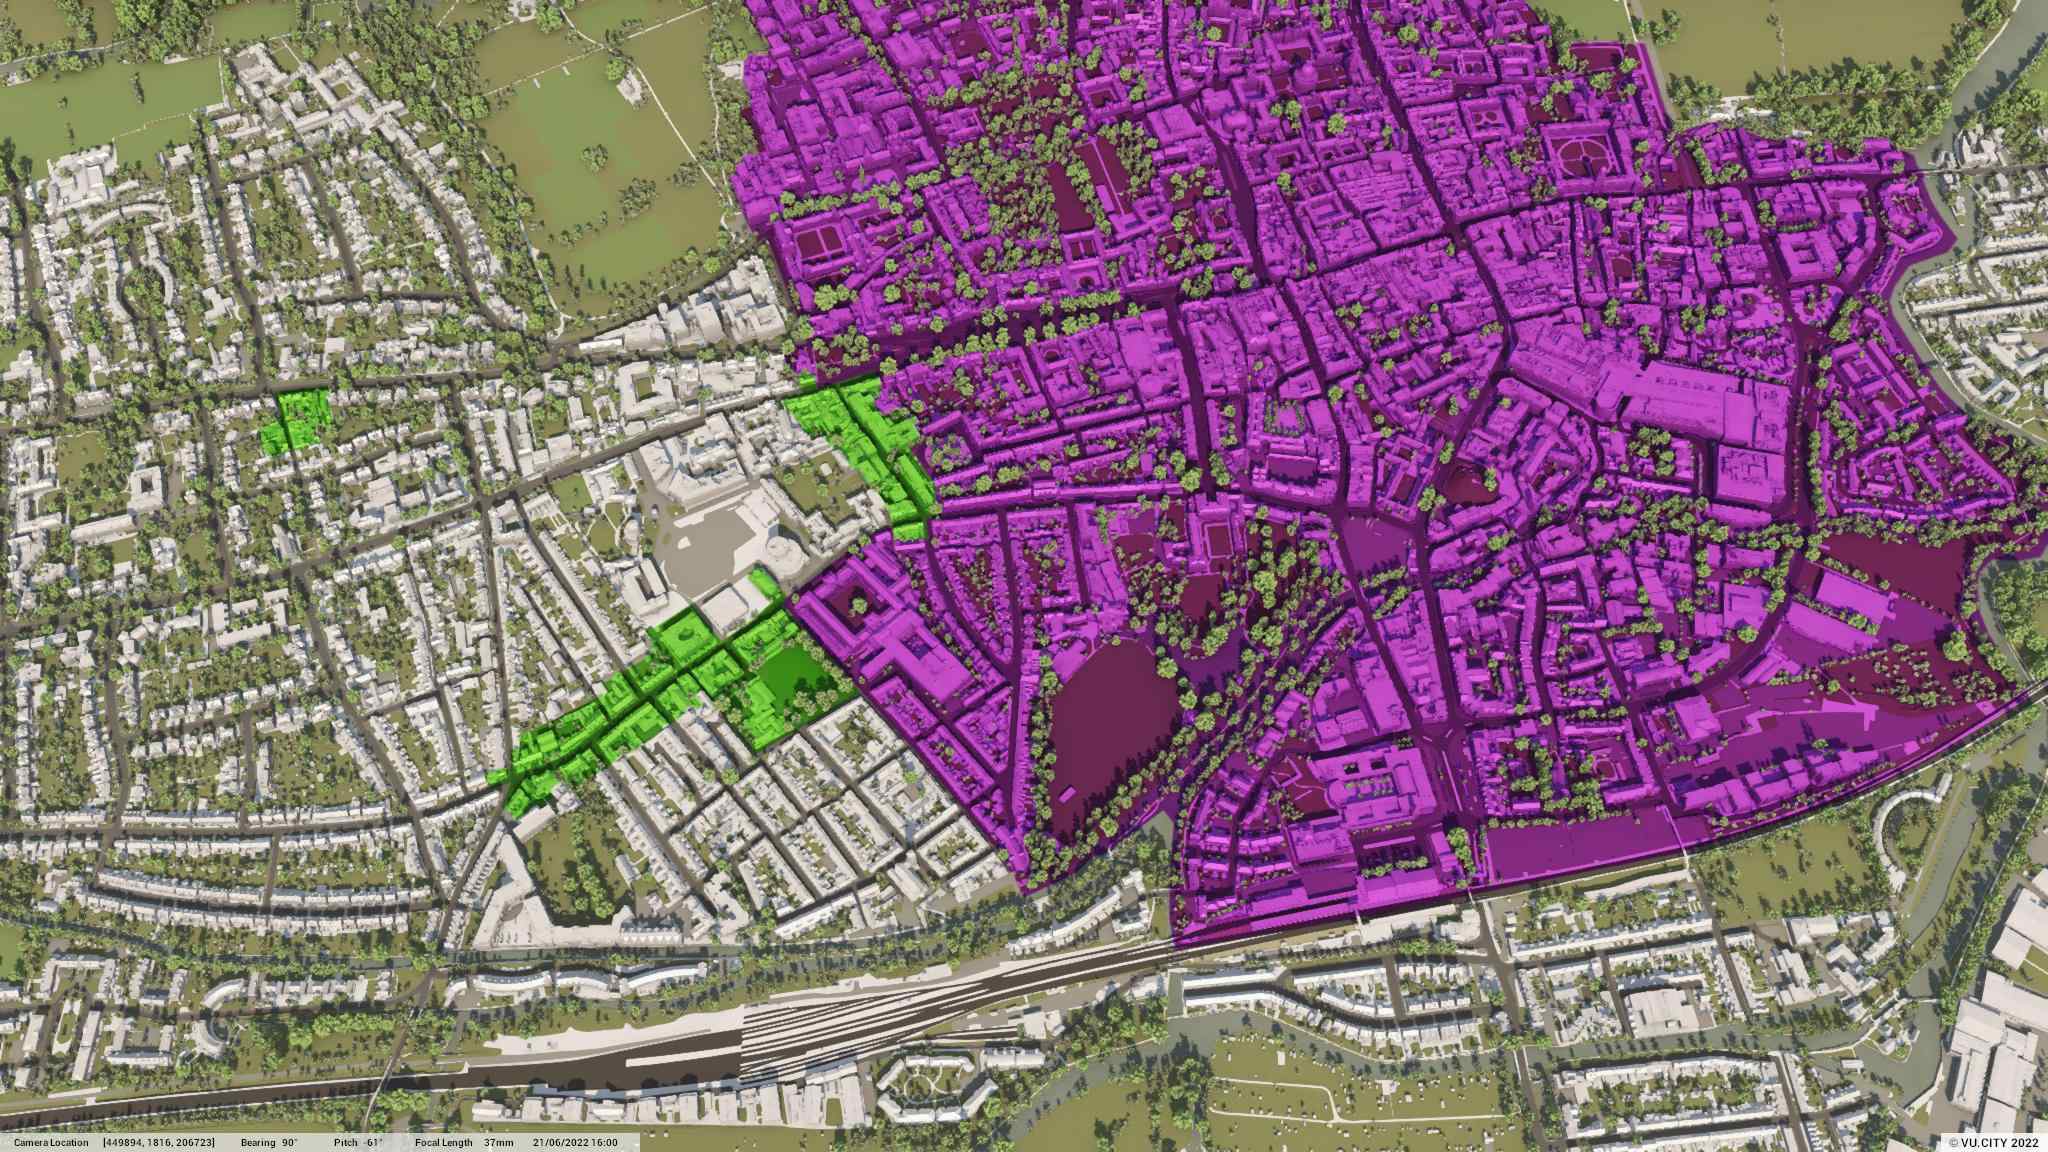
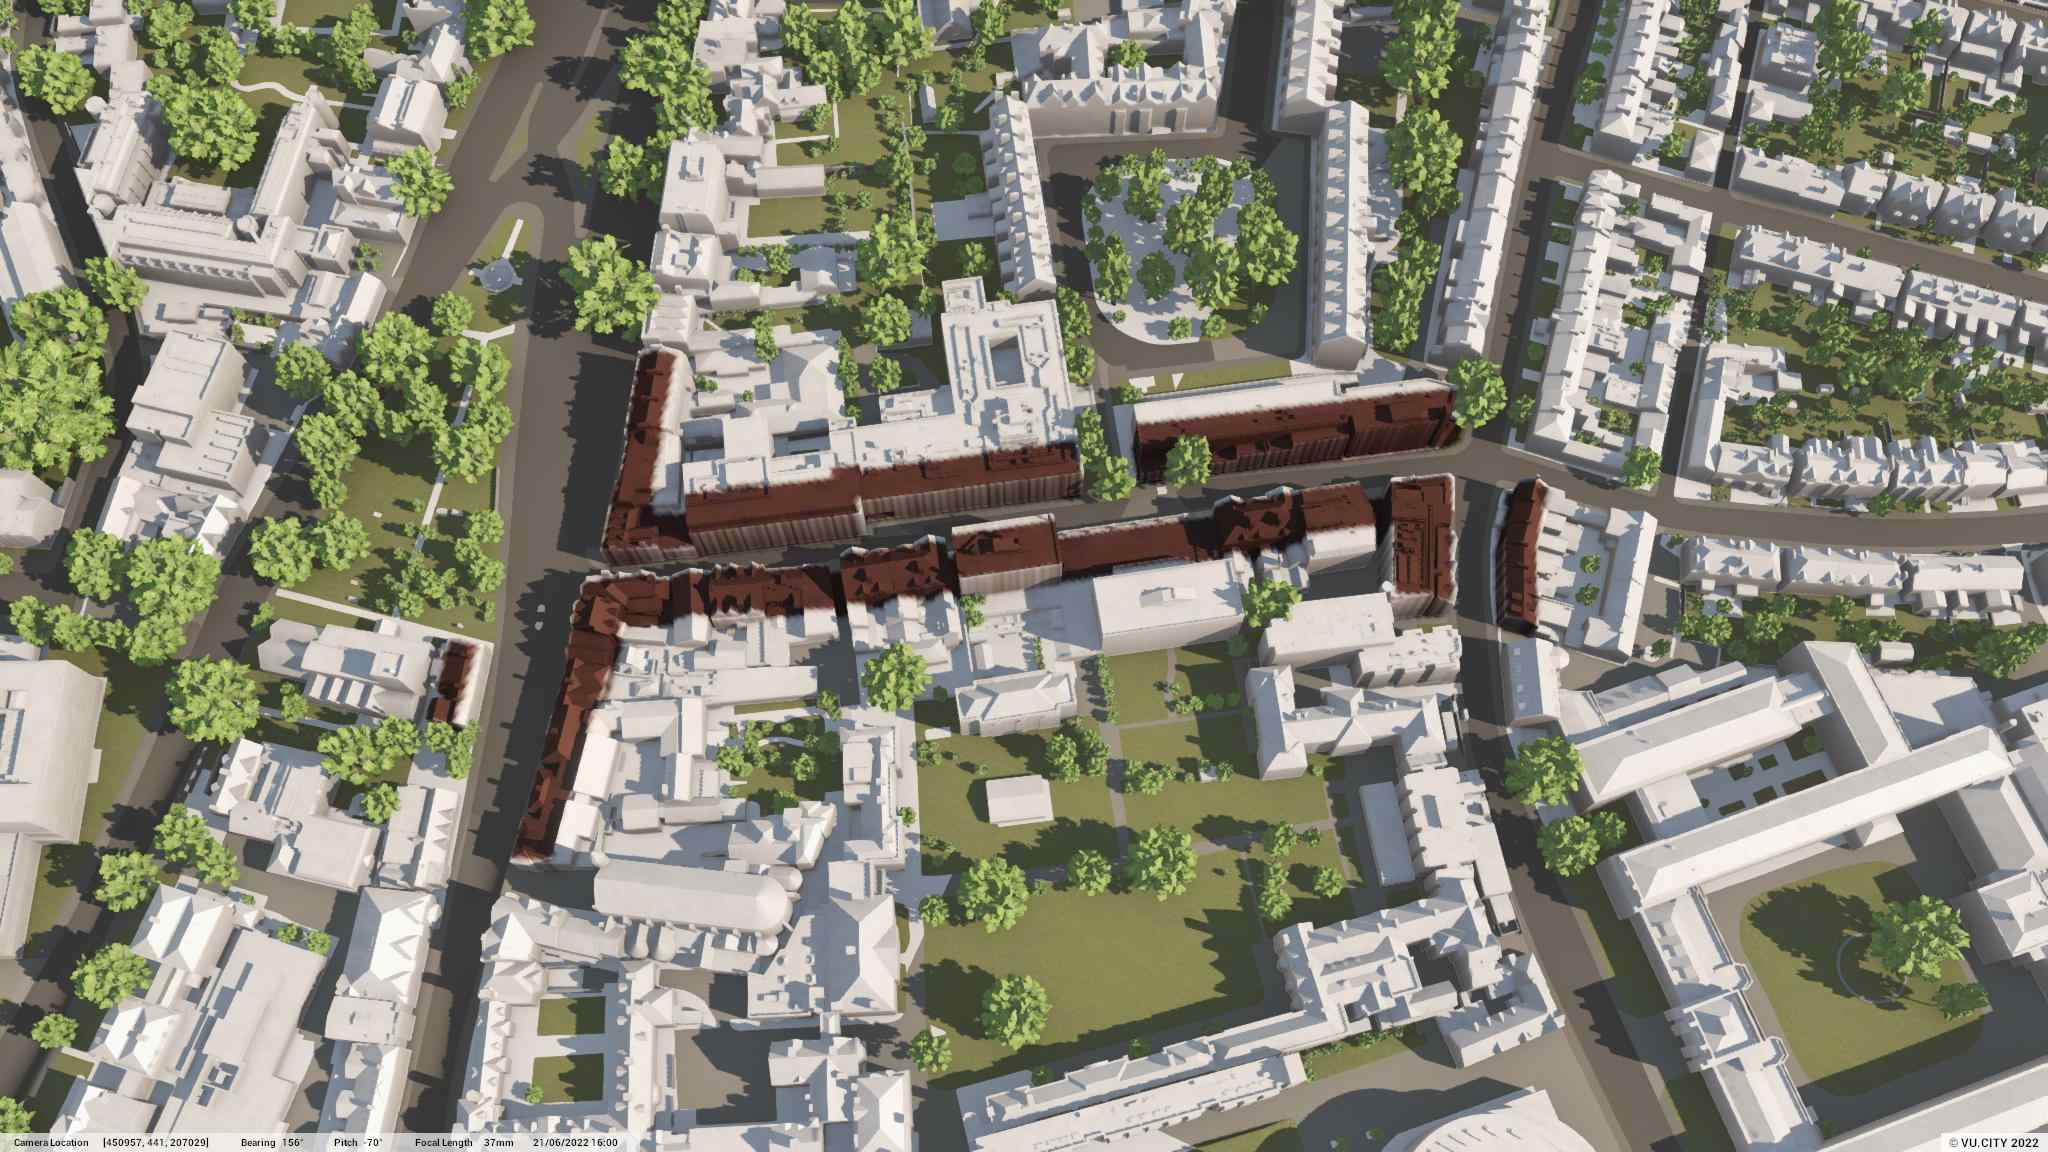
Zone of Theoretical Visibility
Save time by eliminating unnecessary views for analysis. Understand where your scheme can be seen from and which views are critical to assess.

Scope, Design & Collaborate
VU.CITY's project collaboration space, the Hub, allows you to seamlessly communicate with stakeholders, to make better design & planning decisions, faster.

Annotate with Tags
Mark up comments and actions and easily collaborate on a site or scheme with project team members.
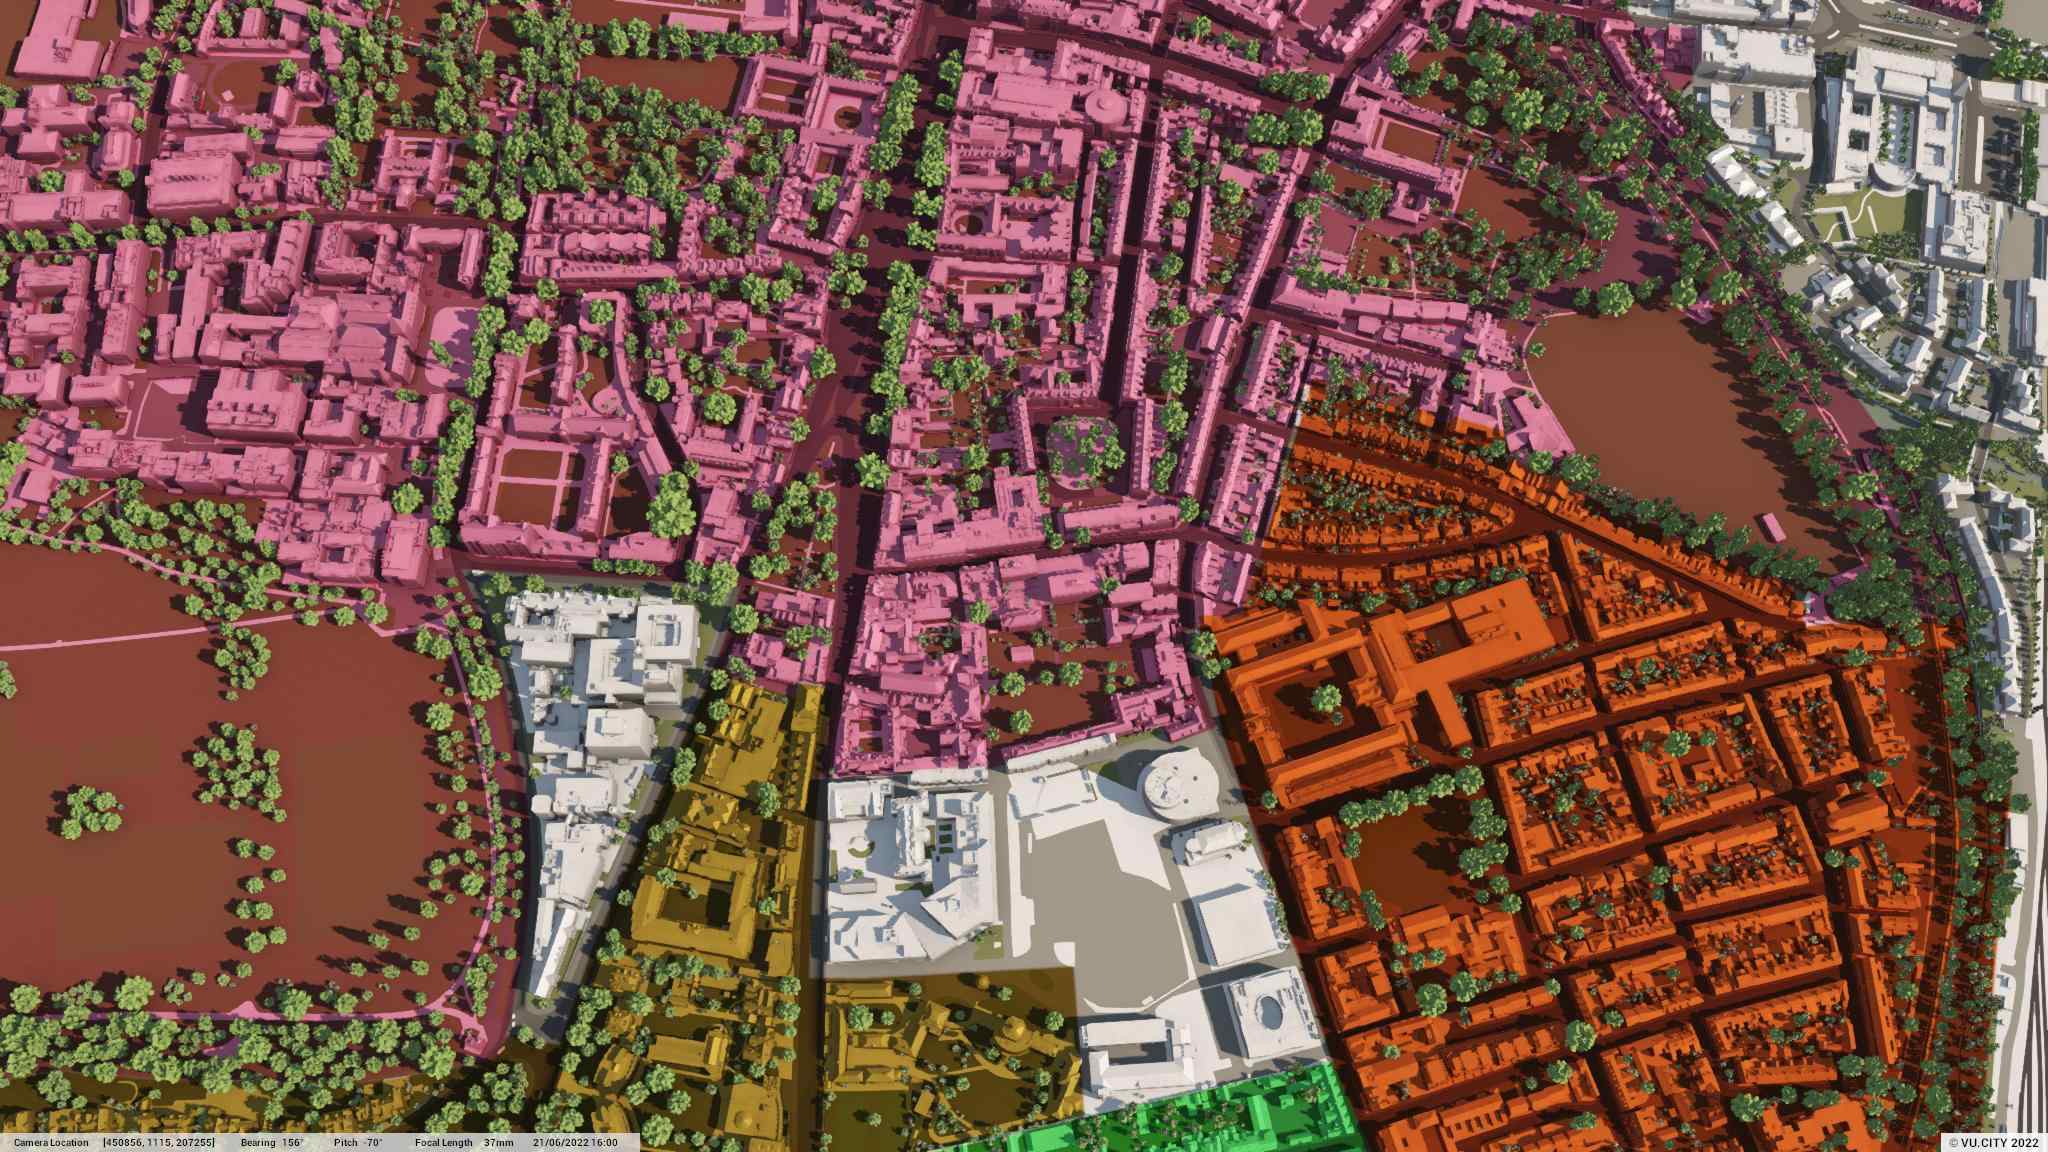
Data Layers

Data Layers
Data Layers
Data Layers
Data Layers
Data Layers
Data Layers
Data Layers
Data Layers
Data Layers
Data Layers
Data Layers
Data Layers
Data Layers
Data Layers
Data Layers
Data Layers
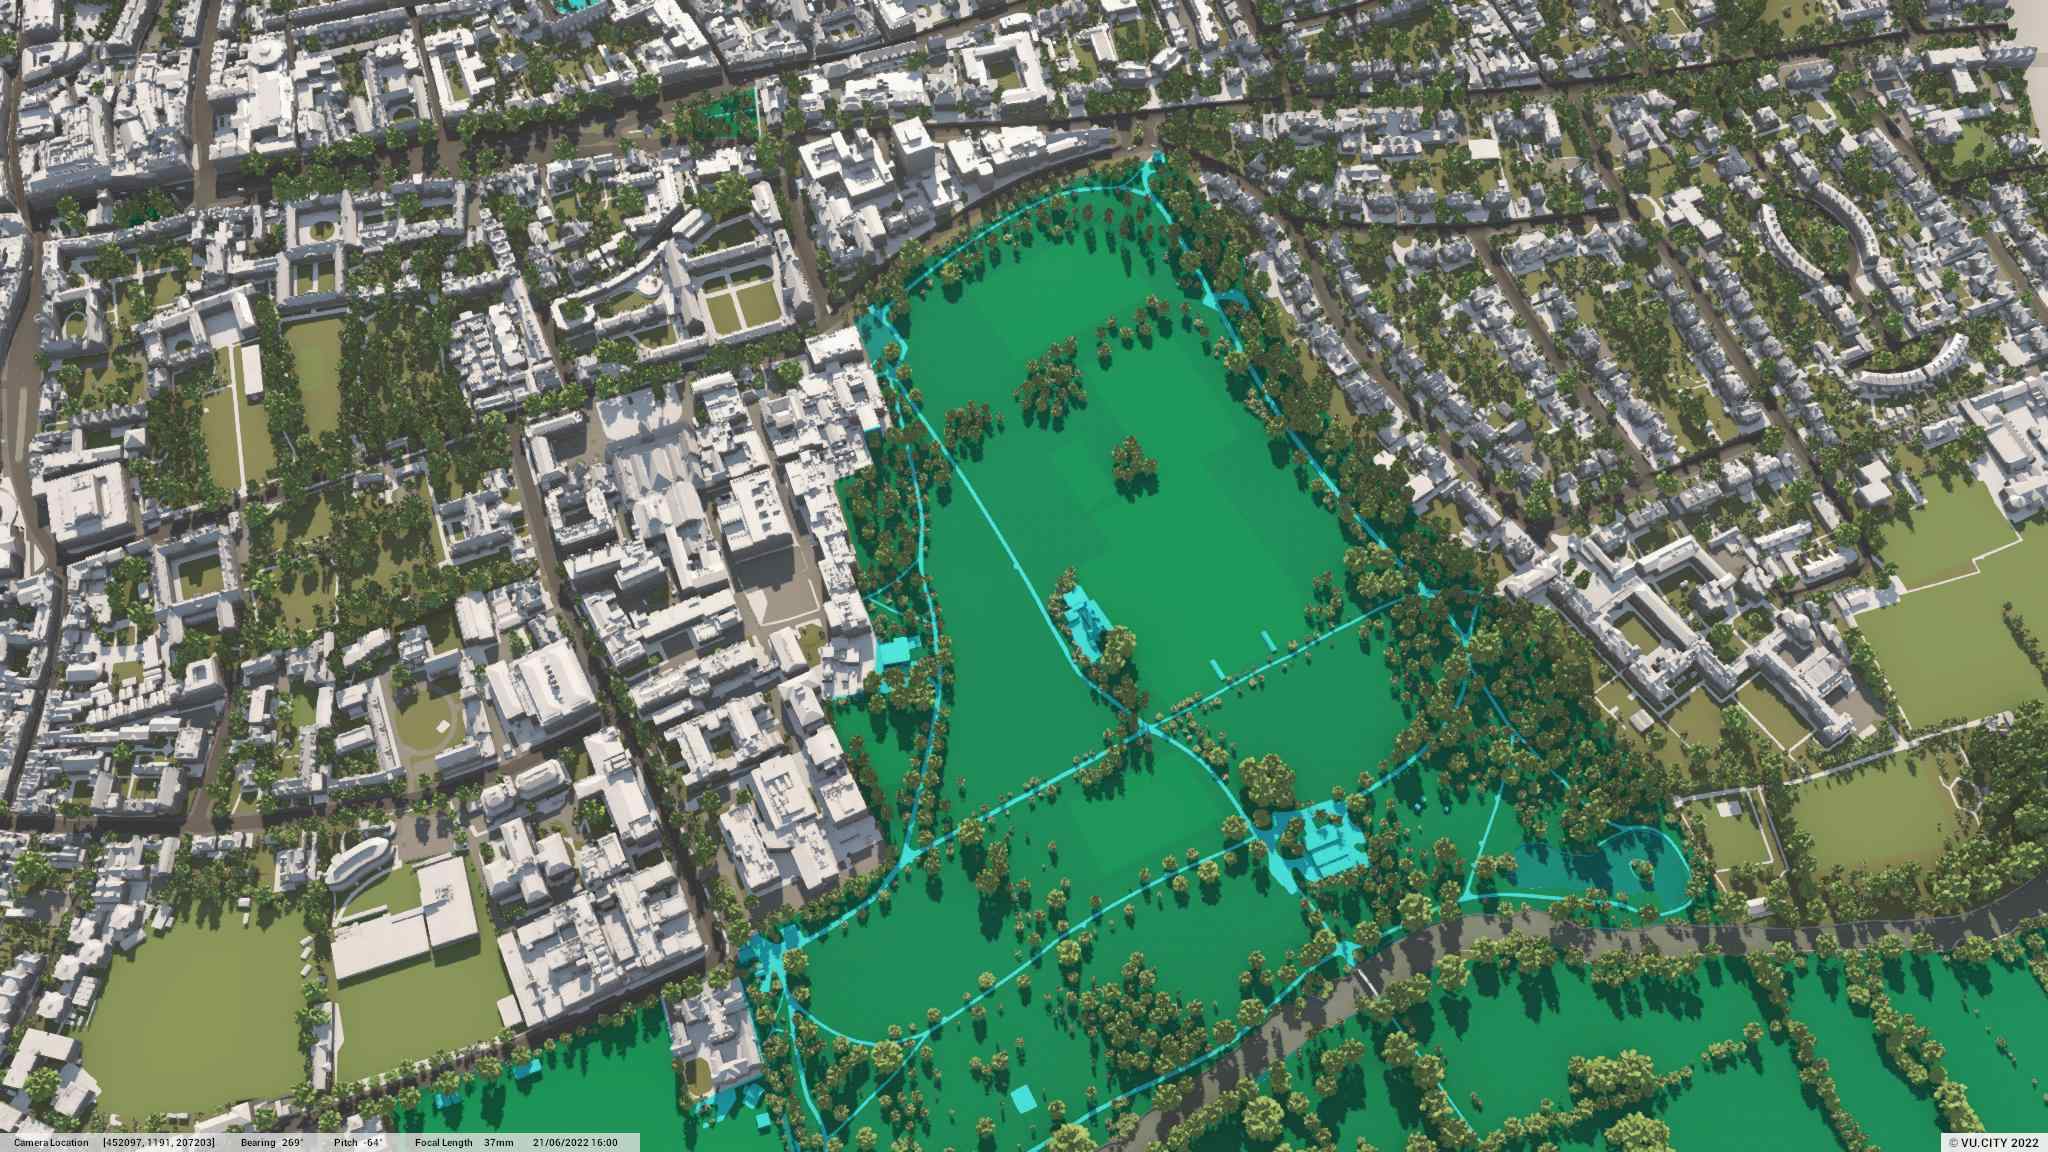
Data Layers
Data Layers
Data Layers
Data Layers
Data Layers
Data Layers
Data Layers
Data Layers
Data Layers
Data Layers
Data Layers
Data Layers
Data Layers
Data Layers
Data Layers
Data Layers

OXFORD COVERAGE


Create smart cities the smart way
VU.CITY helps organise, visualise, and analyse city data in the clearest and most accessible way to make better decisions.
VU.CITY covers the whole of London and 25 major UK and international cities.
Transform design and planning
Quickly identify and appraise sites. VU.CITY's visualization, design functionality and planning data, allow you to optimise your designs.

Build trust and collaboration
Now everyone involved can have a clear, universal understanding of what’s proposed and why, in a single, secure place. VU.CITY makes decision-making democratic and fair.

Improve
outcomes
Remove barriers and minimise risks early. Have confidence in your designs and plans. Increase buy-in for project success.

Test out ideas in situ, from one building to a masterplan. Create your vision and submissions with confidence.
Collate site information in one place

Communicate complex spatial arrangements

Make documentation stand up and stand out

Speed up planning conversations

Strengthen relationships
Create winning submissions

Discover where there is potential for change, and help everyone easily understand what’s involved and why.
Collate site information in one place
Communicate complex spatial arrangements
Speed up the planning process
Speed up planning conversations
Strengthen relationships
Create winning submissions
Reduce guesswork and unwanted costs – make the right decisions for the right outcomes, faster.
Appraise site capacity and viability, faster

Save time and costs through collaboration

Reduce planning uncertainties; increase buy-in

Speed up the planning process with better informed decisions
Sell or lease earlier to realise profits sooner

Understand designs and plans with ease, and make decisions with clarity to benefit your city and your communities.
Make the best possible decisions, quicker

Collate site, scheme and planning information in one place

Standardise decision-making

Have informed and transparent conversations
Improve how you consult on policies and plans

Understand the cumulative effects of planning changes

Our Users

.png)