Brighton 3D Model
Minimise project risks with our Brighton 3D Model functionality. Rich data layers help lower design and planning uncertainty, highlight potential impacts, and accelerate key decision-making for projects.
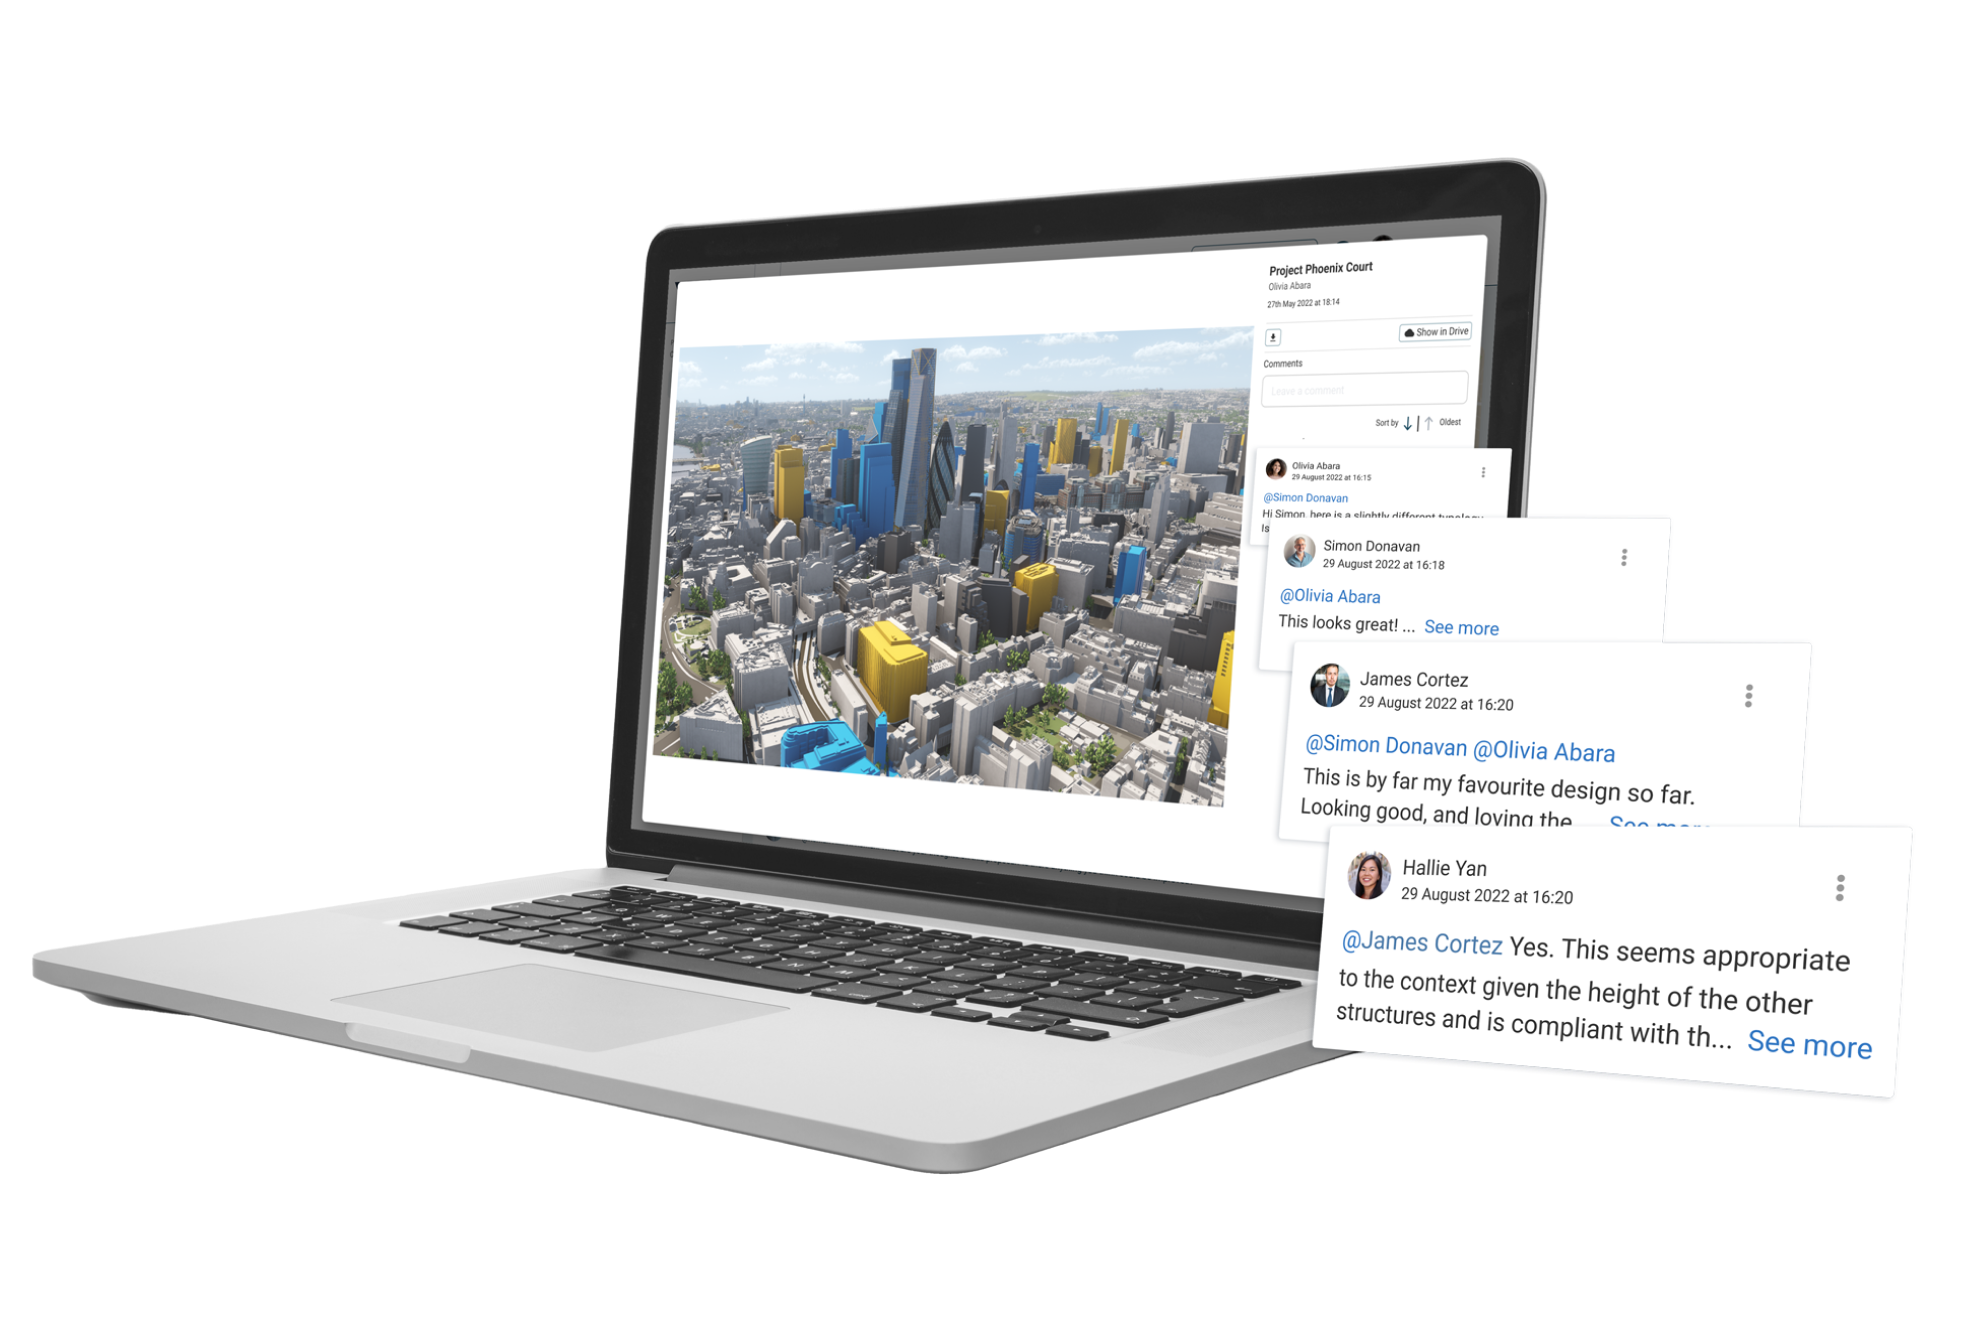
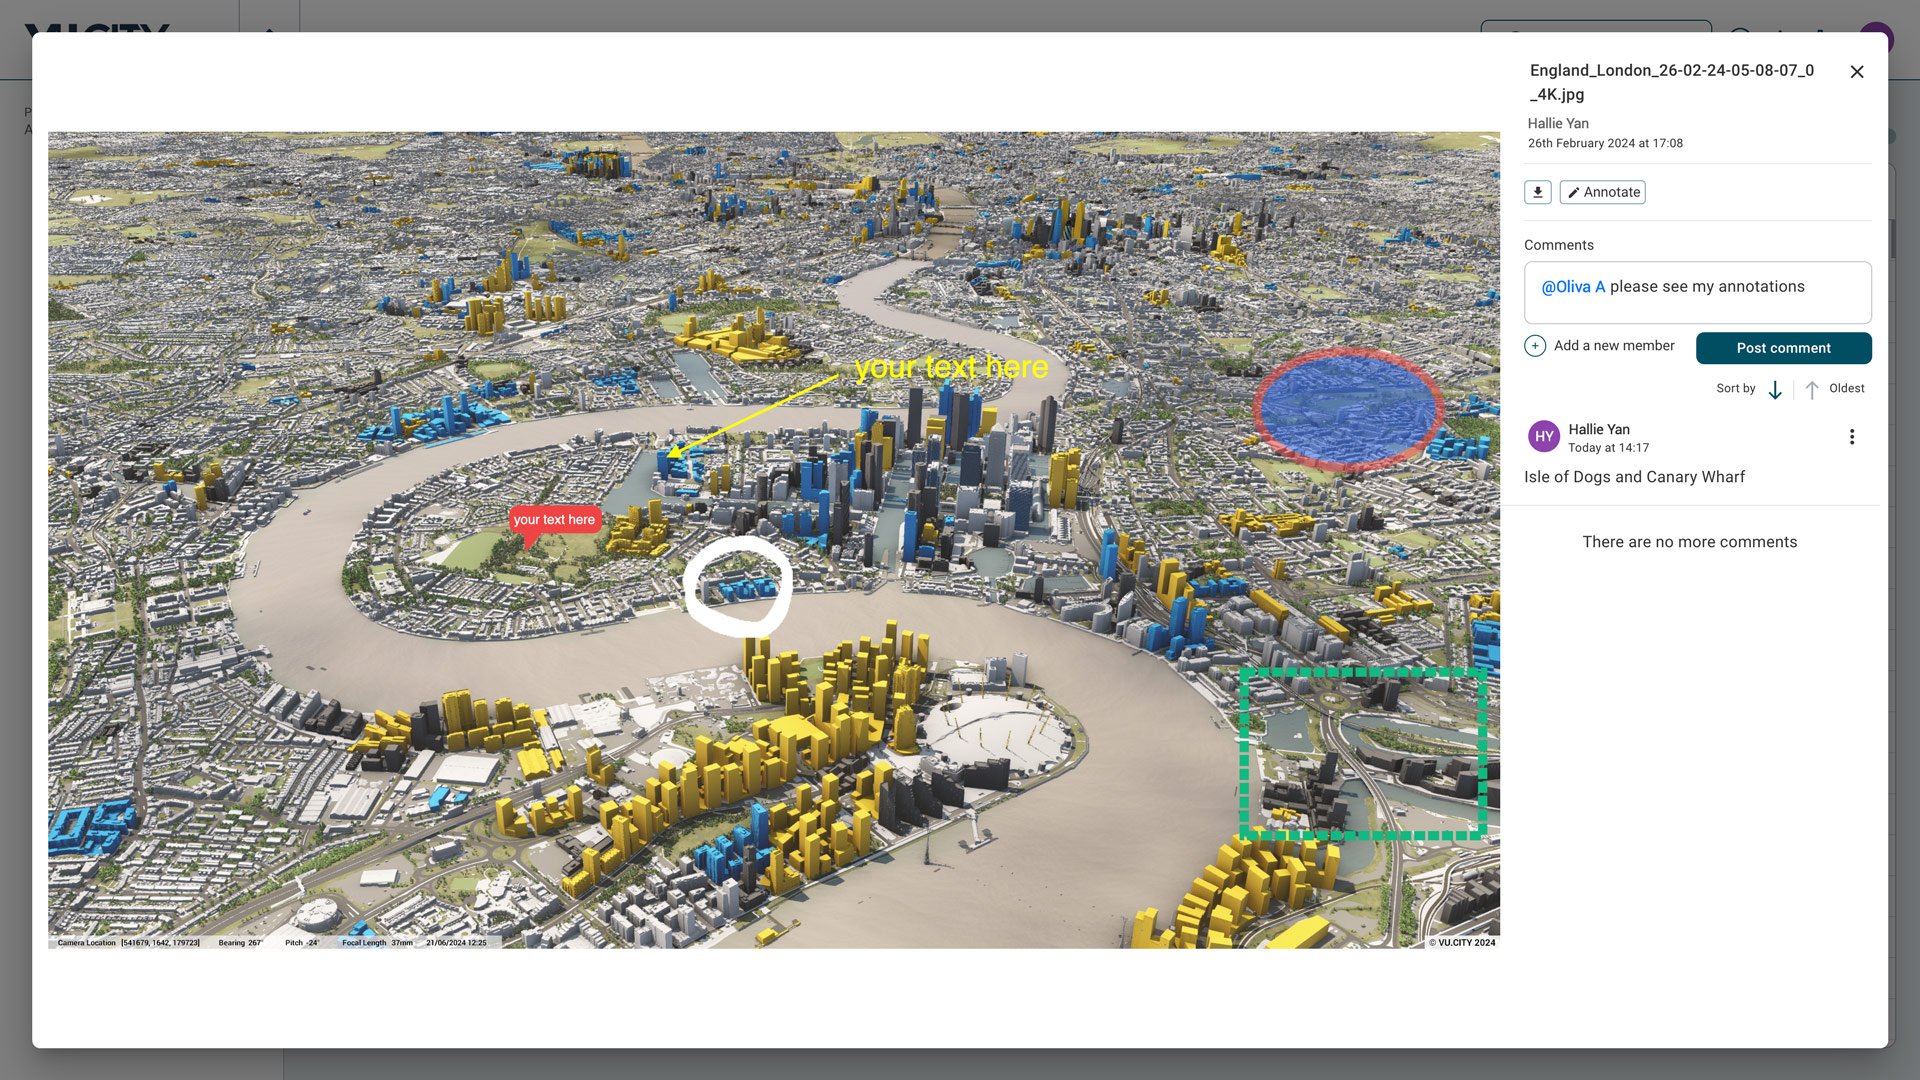
With VU.CITY’s accurate and intuitive 3D digital twin platform, all stakeholders can expect smooth collaboration, making smarter decisions and help increase planning success in the built environment.
-
40DATA LAYERS
-
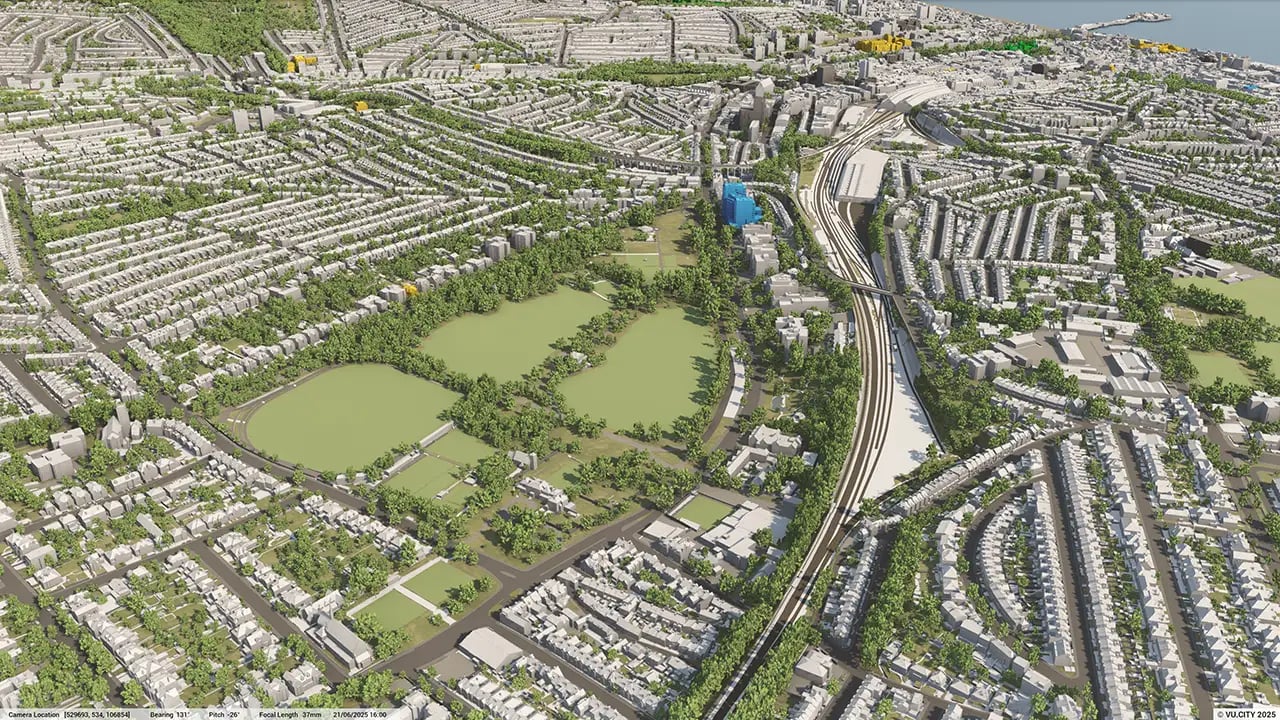
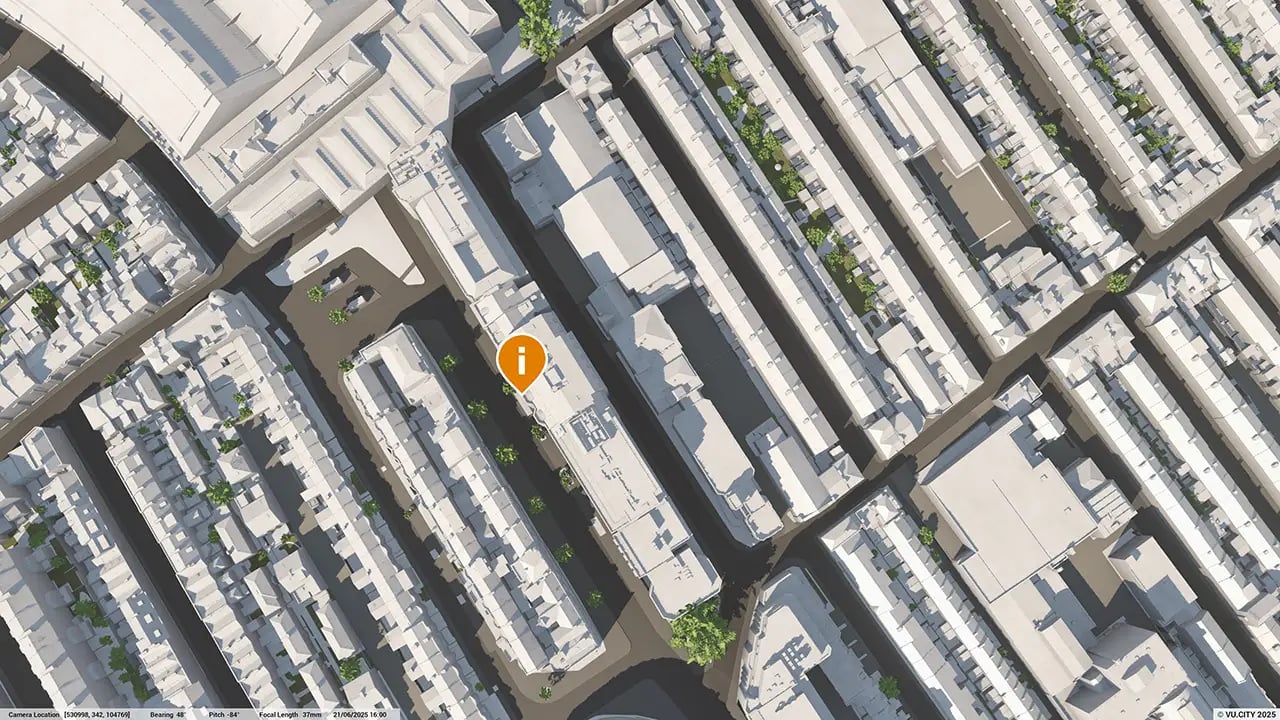
38.75 sq kmMODELLED TO 15CM ACCURACY
-
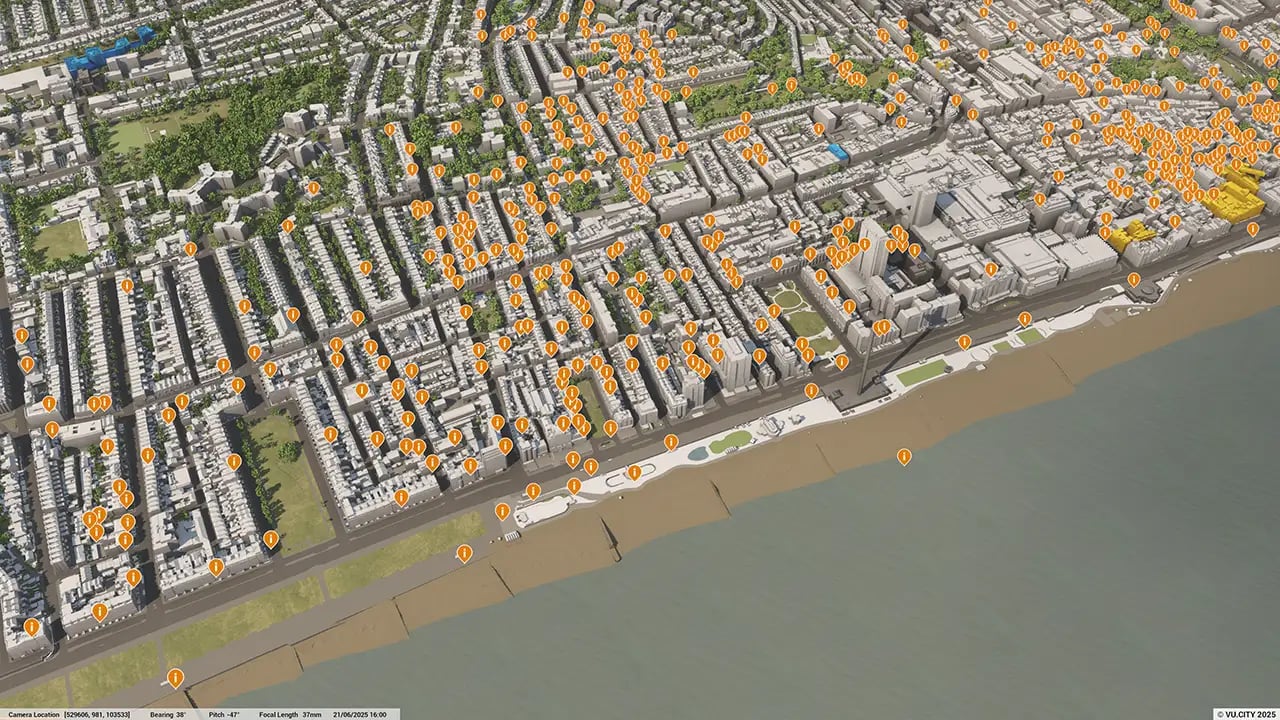
103Consents approved VU.CITY
-
185,887TREES, ACCURATE HEIGHT AND CANOPY

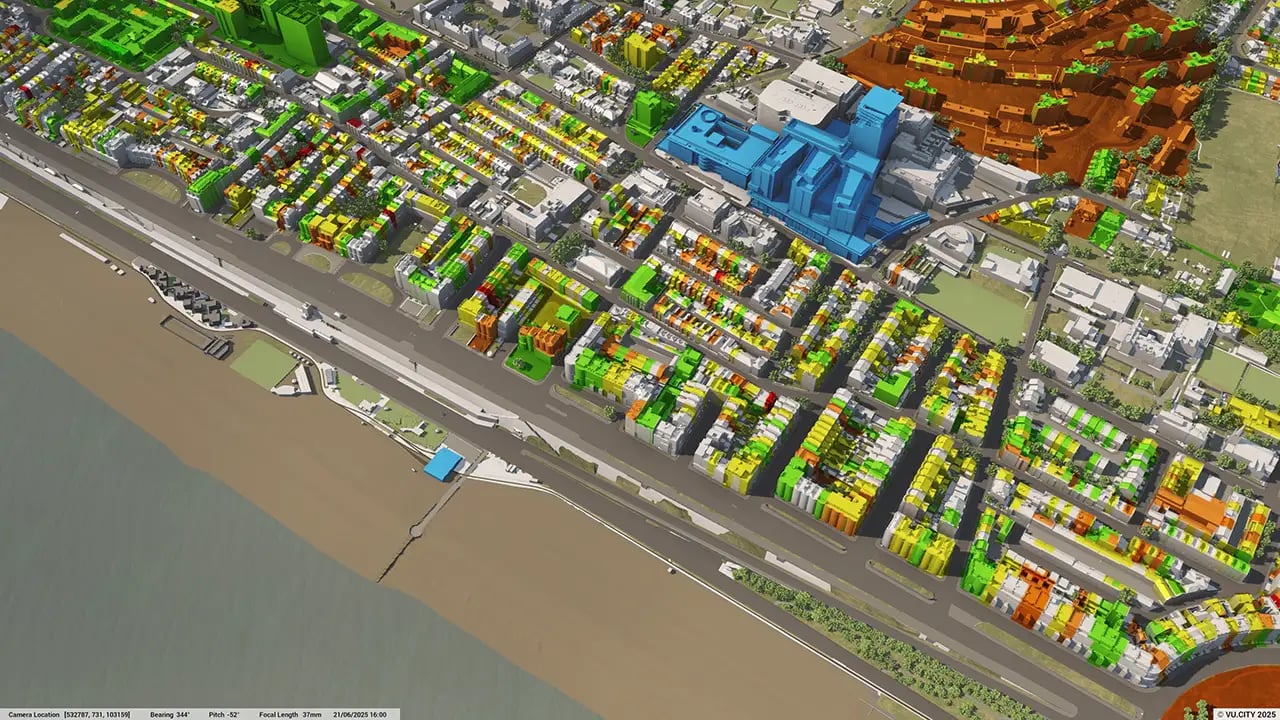
Brighton data layers
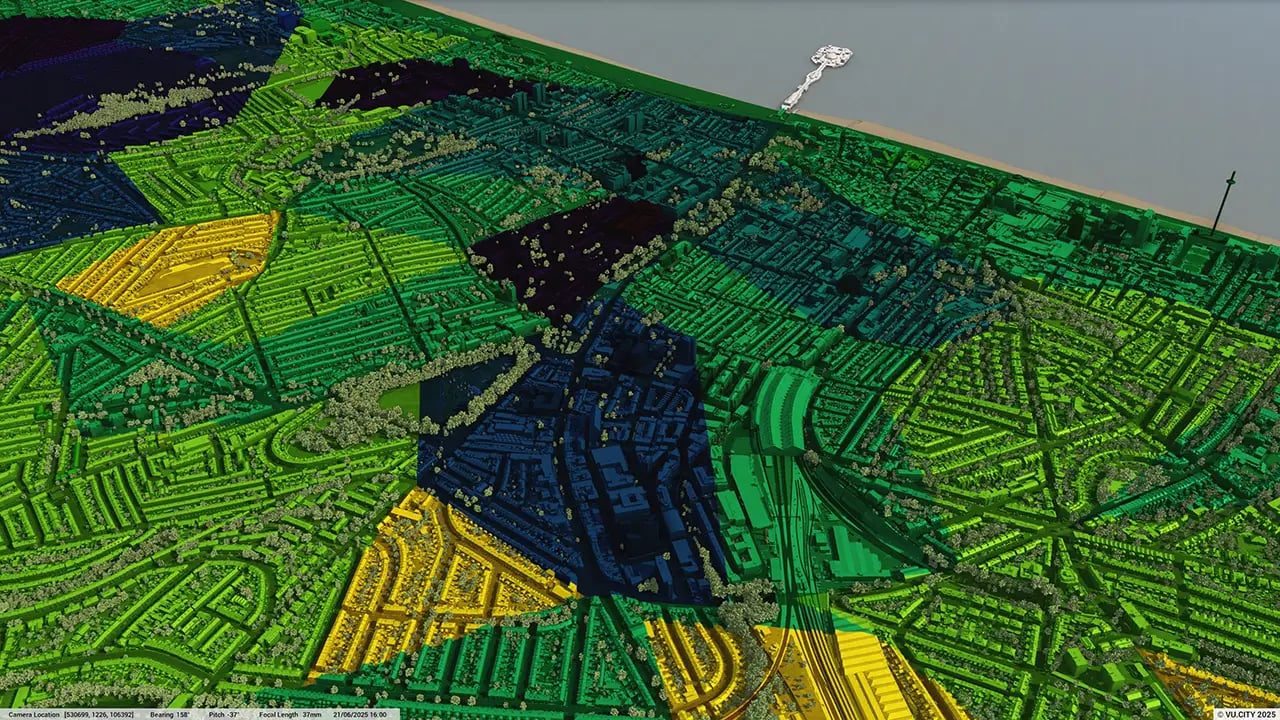
From transportation and zoning to environmental factors, VU.CITY Brighton 3D model data layers provide essential insights for more informed and confident decision-making.
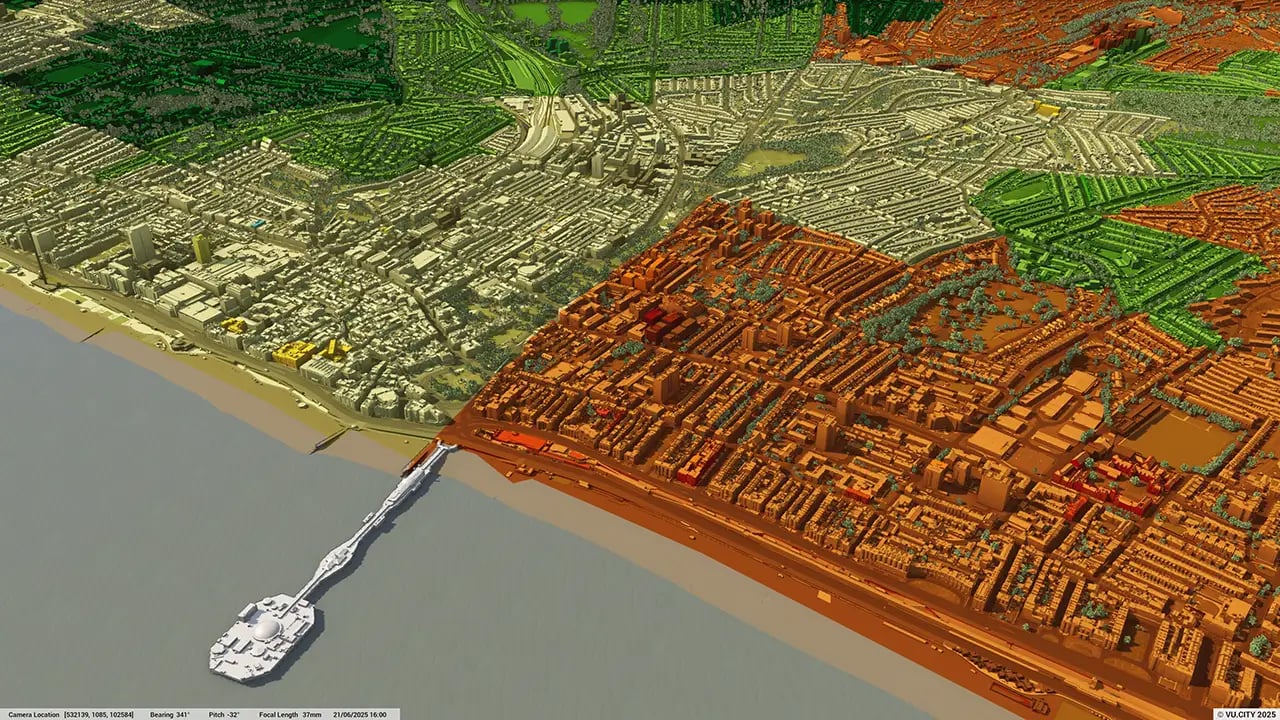
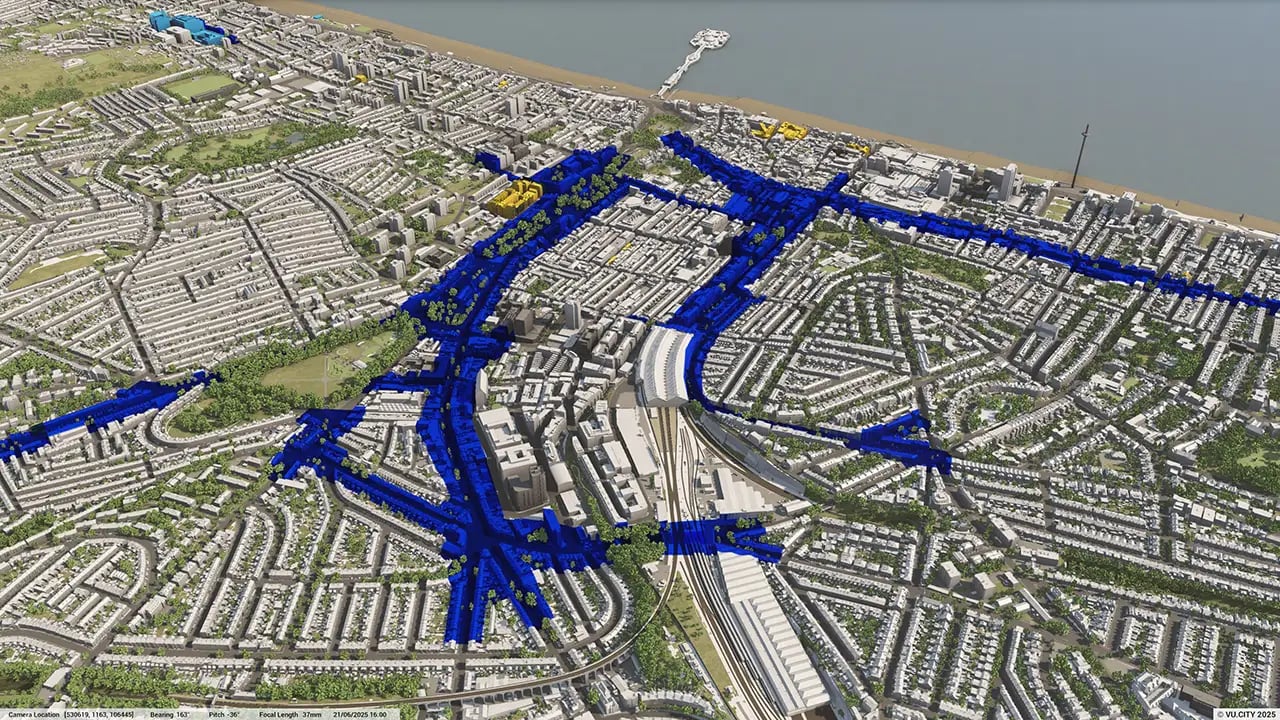

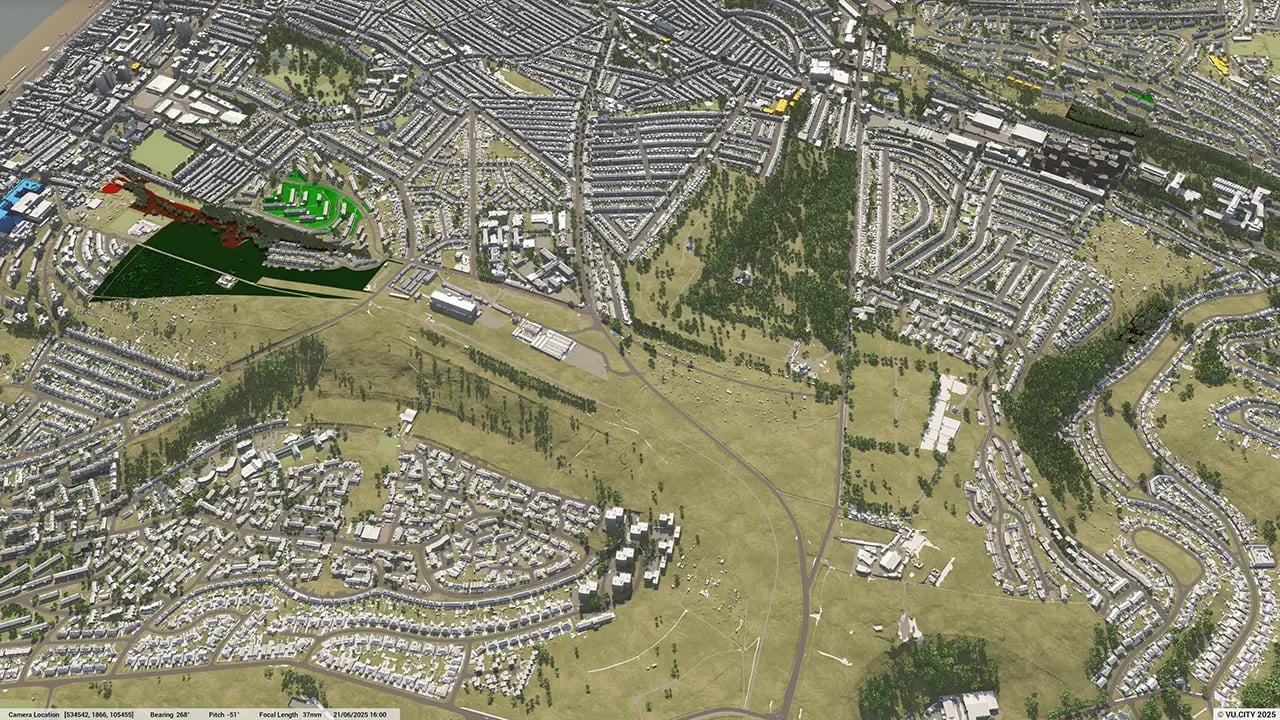
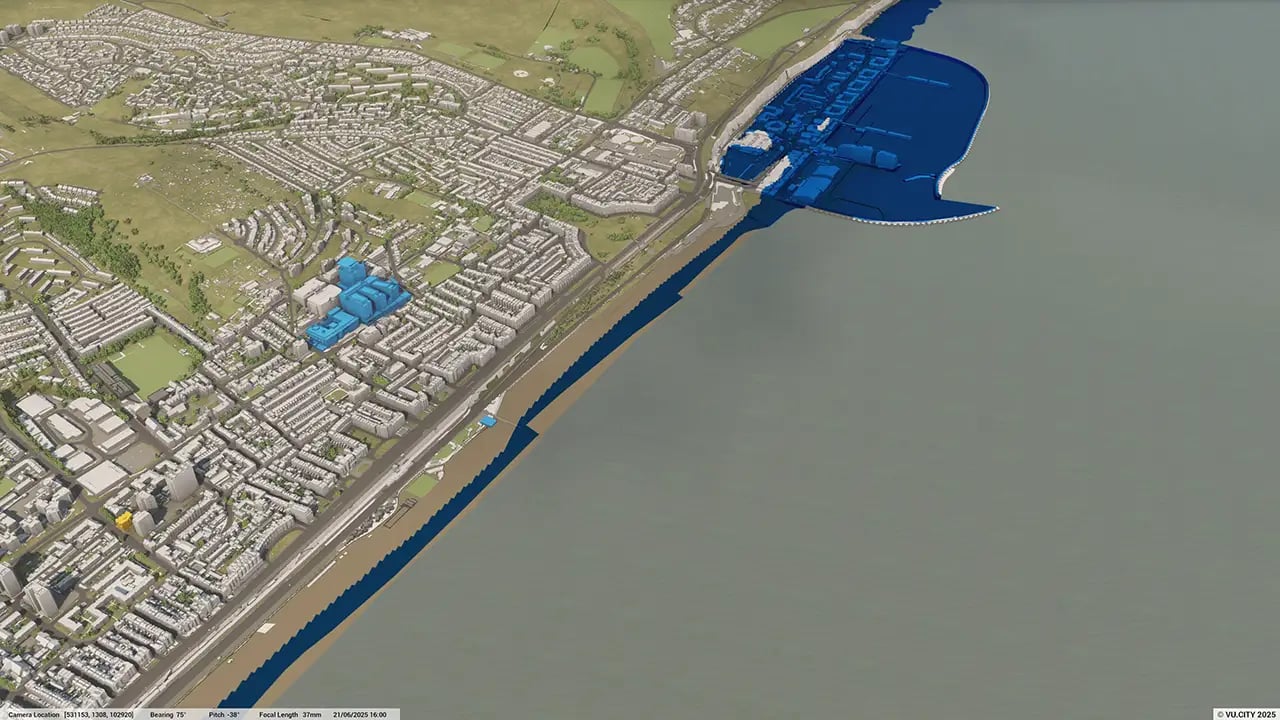
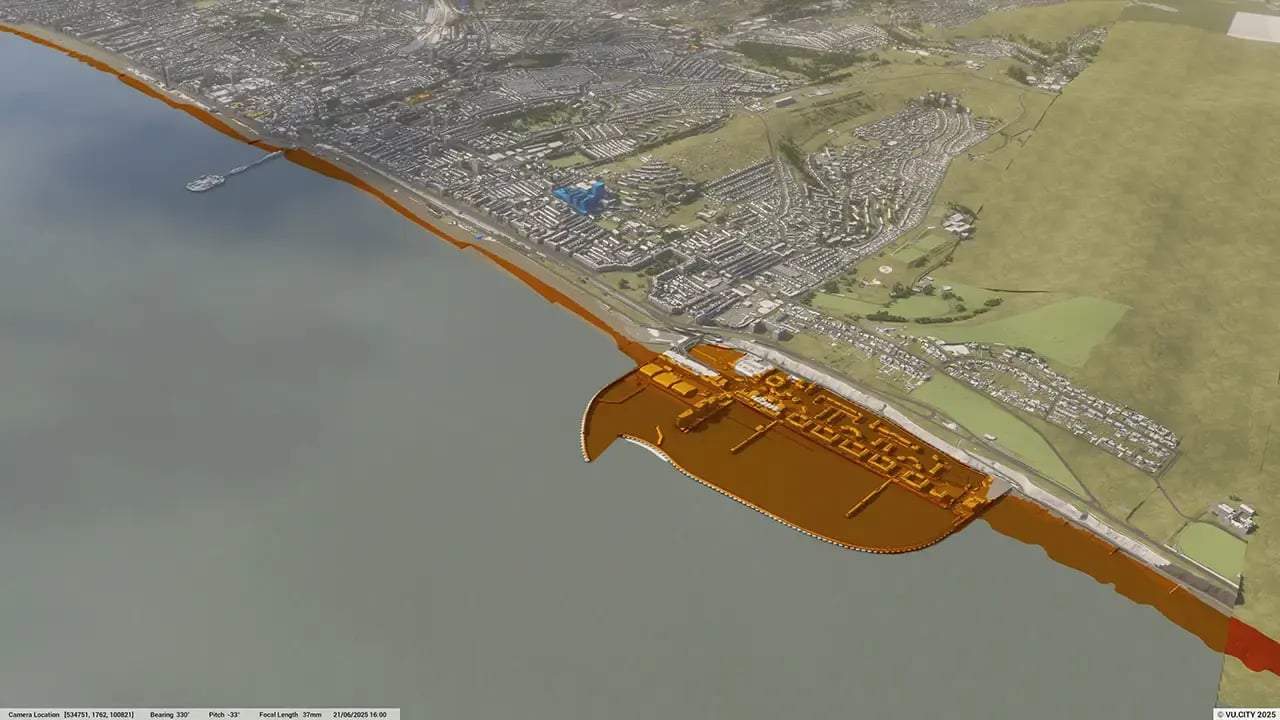
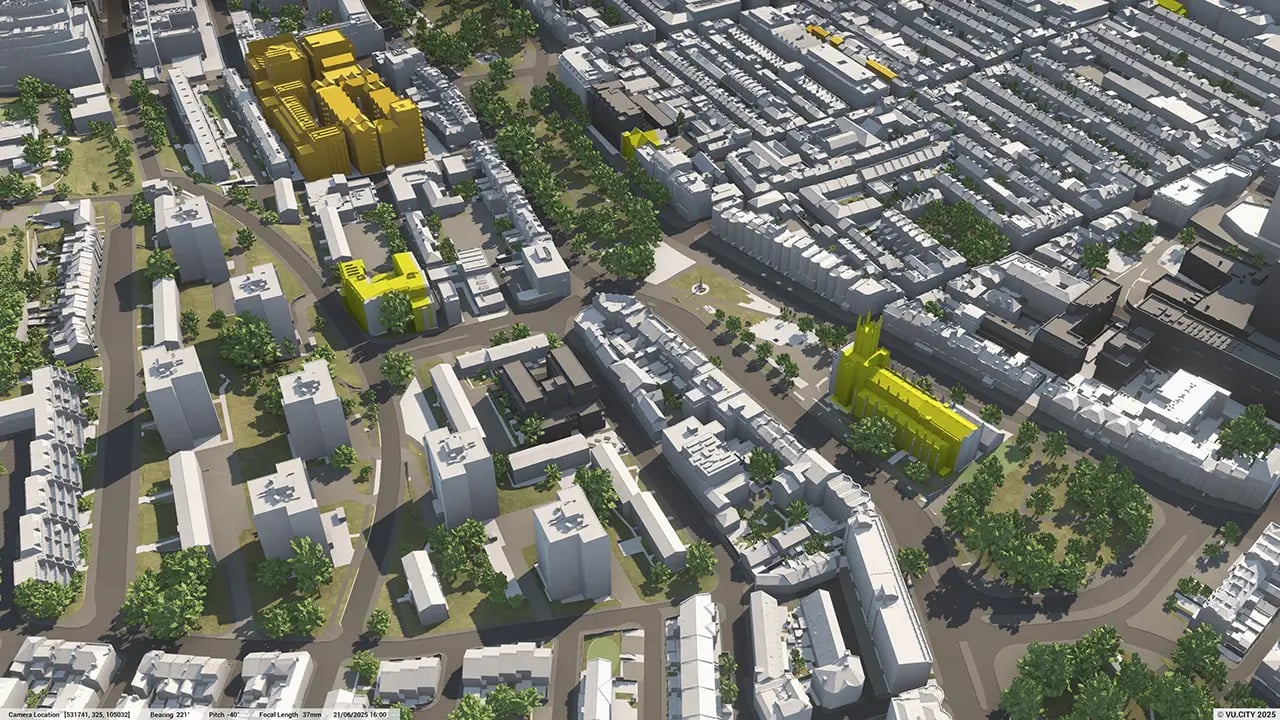
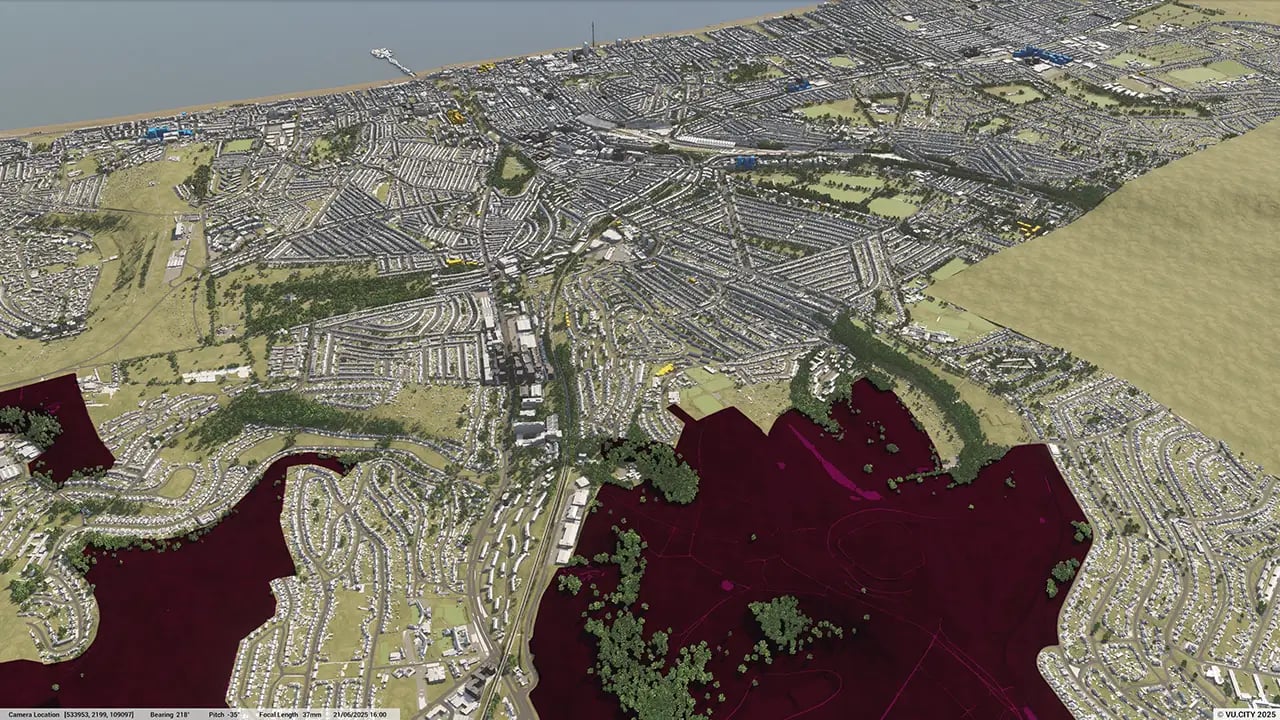
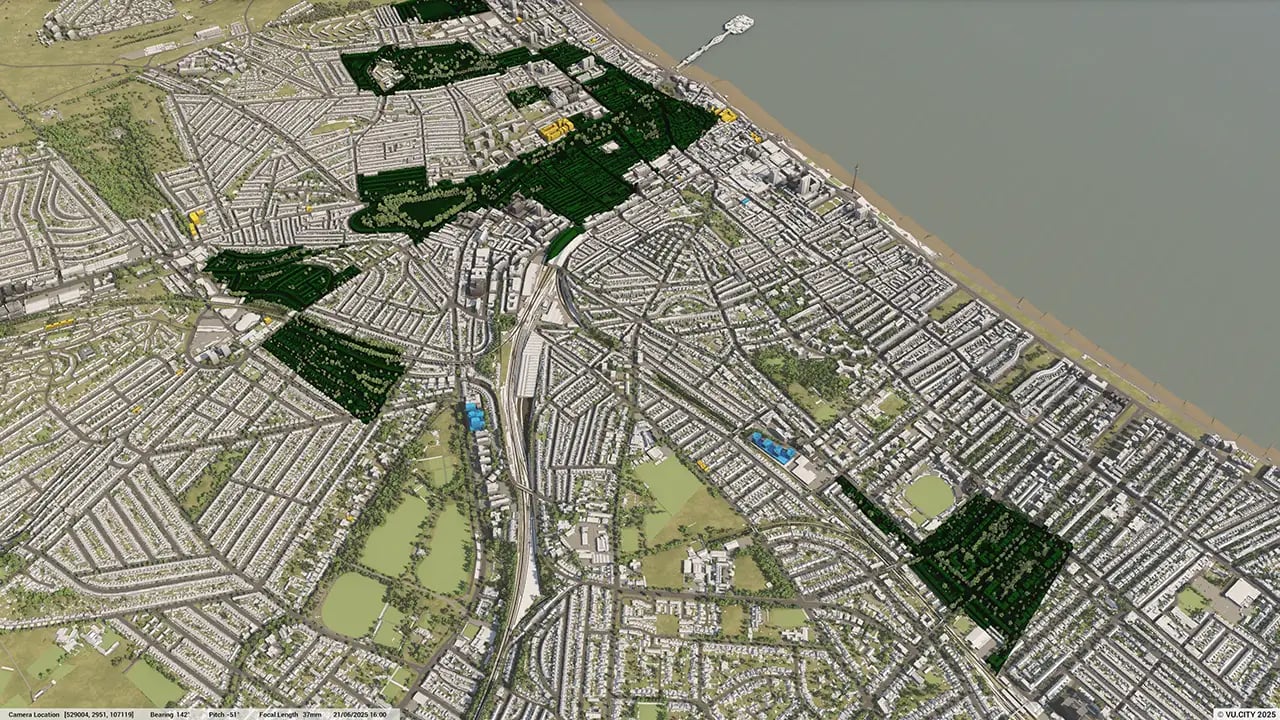
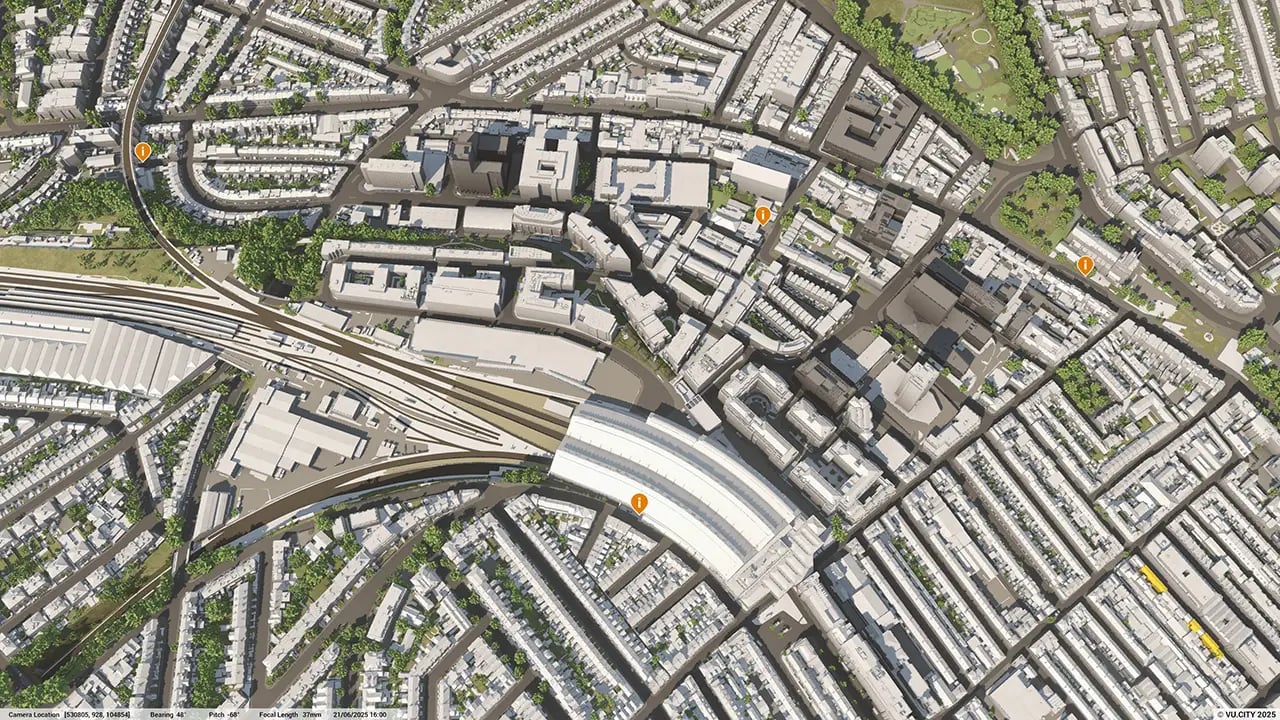
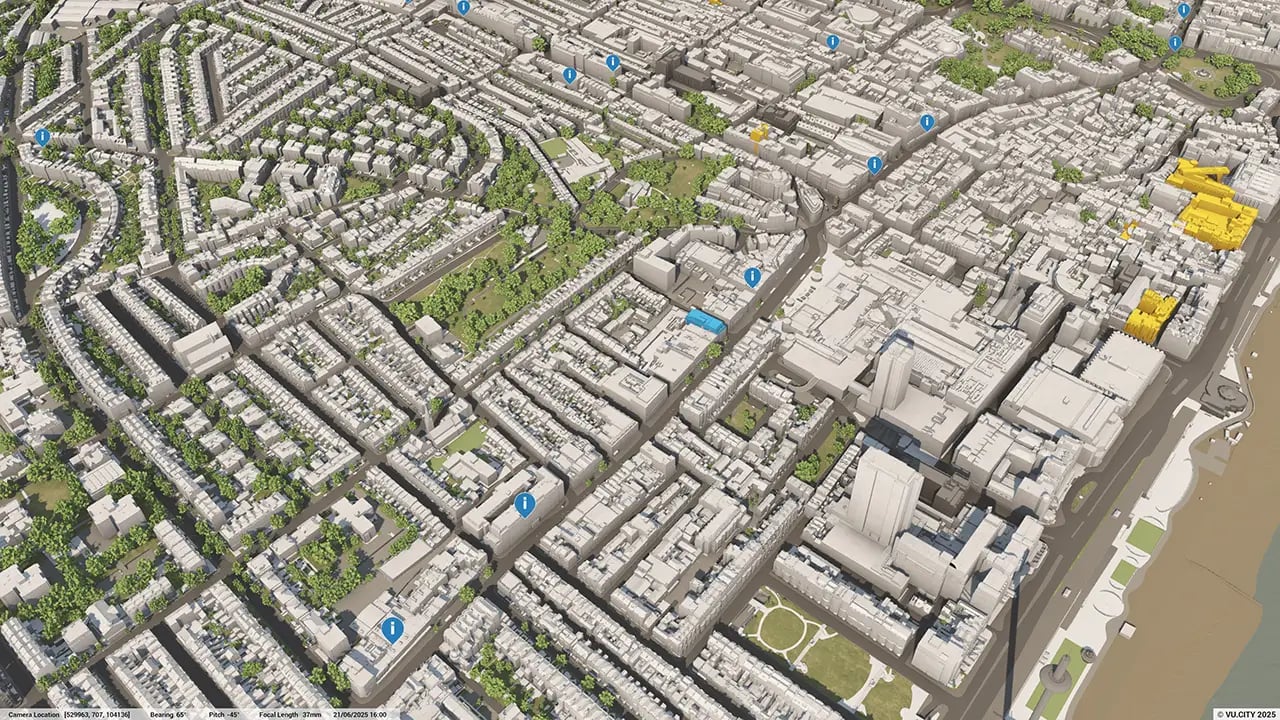

Brighton presents challenges for architects and developers due to its positioning: this tightly constrained, compact city is situated like a basin in between the South Downs National Park and the sea. There is limited scope for outward expansion and any development must be sensitive to Brighton’s many expressive landmark buildings, such as the Royal Pavilion and St Bartholomew's Church, together with its strategic views and vistas - particularly if approaching the city from the higher level of the South Downs.
VU.CITY Brighton helps stakeholders consider such wider, complex planning policies clearly and quickly for effective decision-making and outcomes.
The city’s existing housing includes a high proportion of flats, maisonettes and apartments which comprise 50% of the total housing stock.
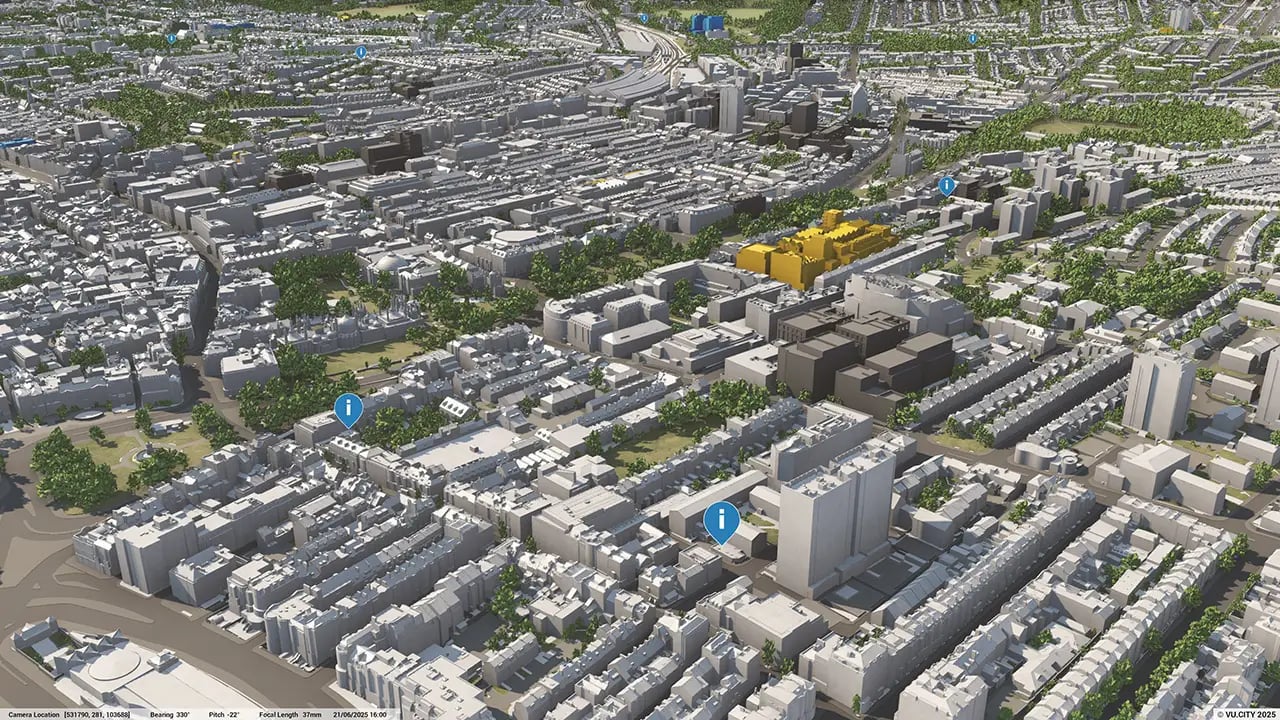
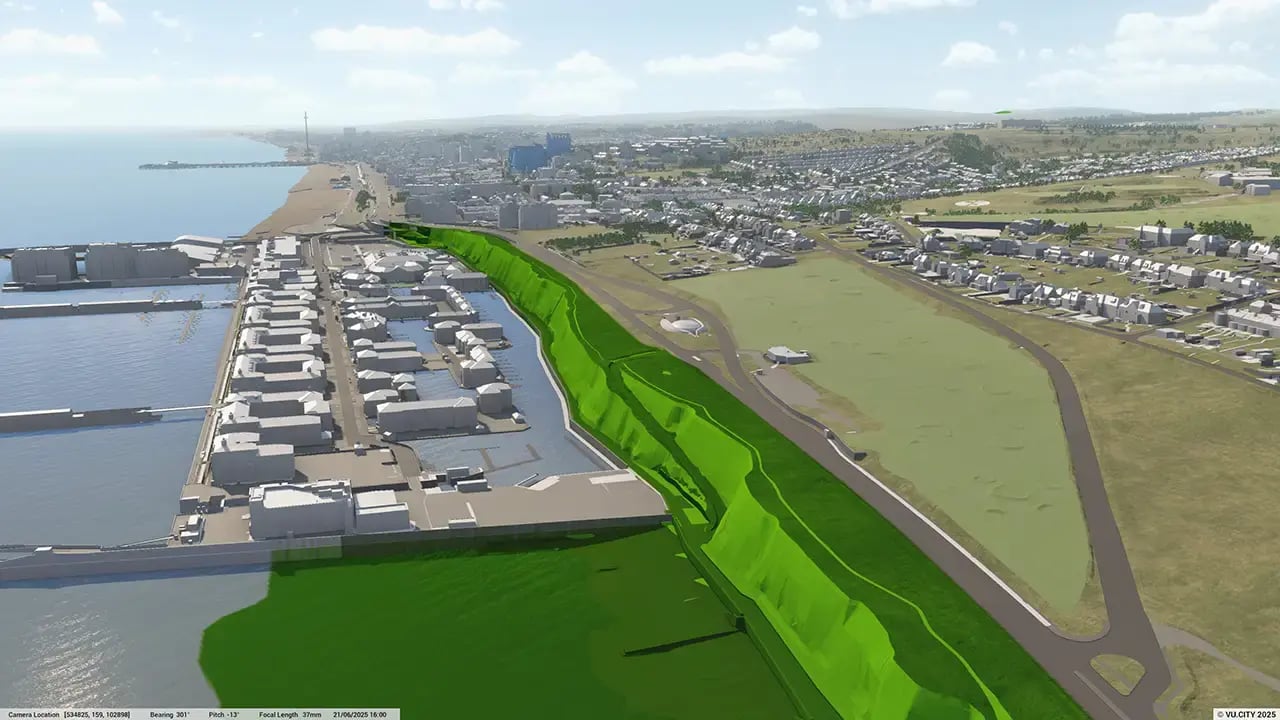
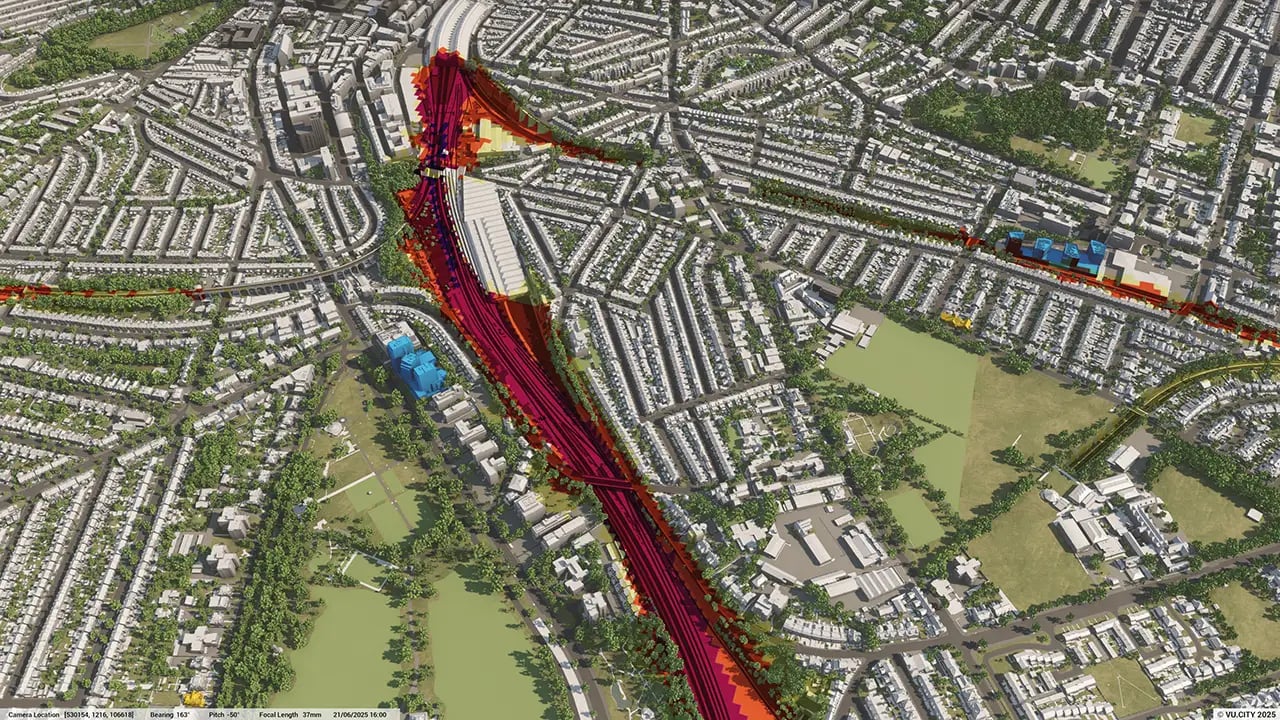
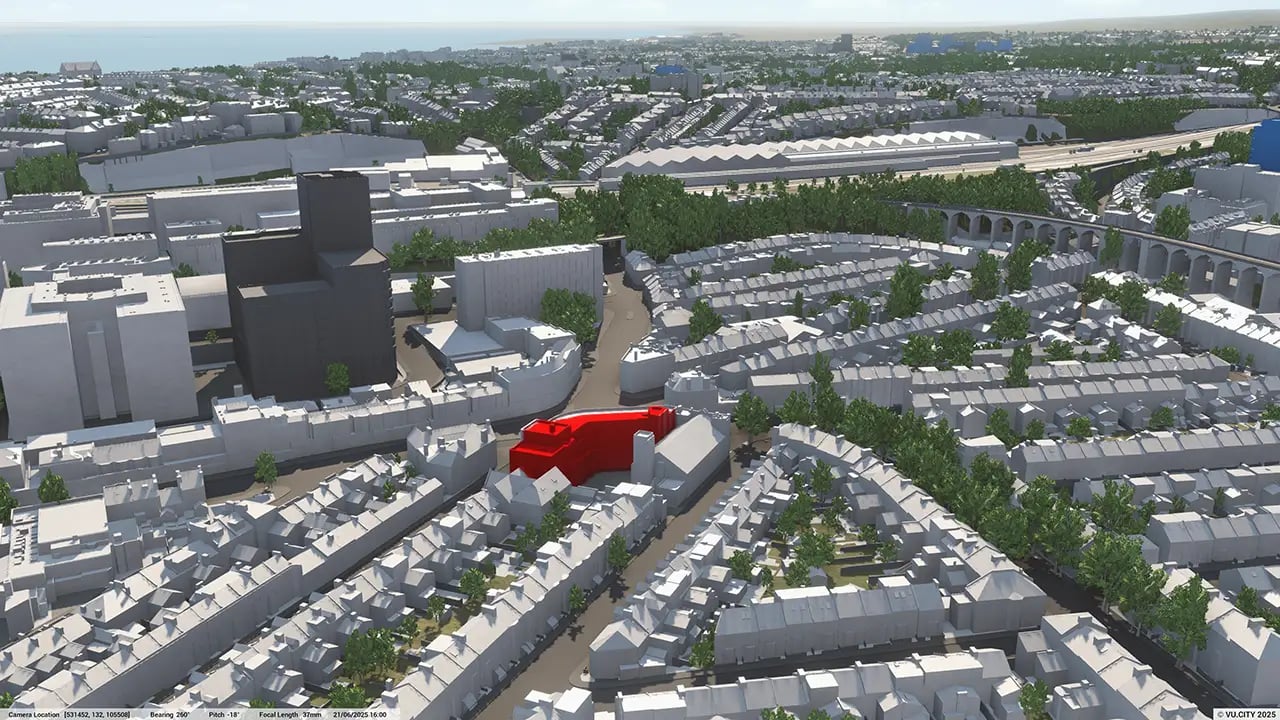
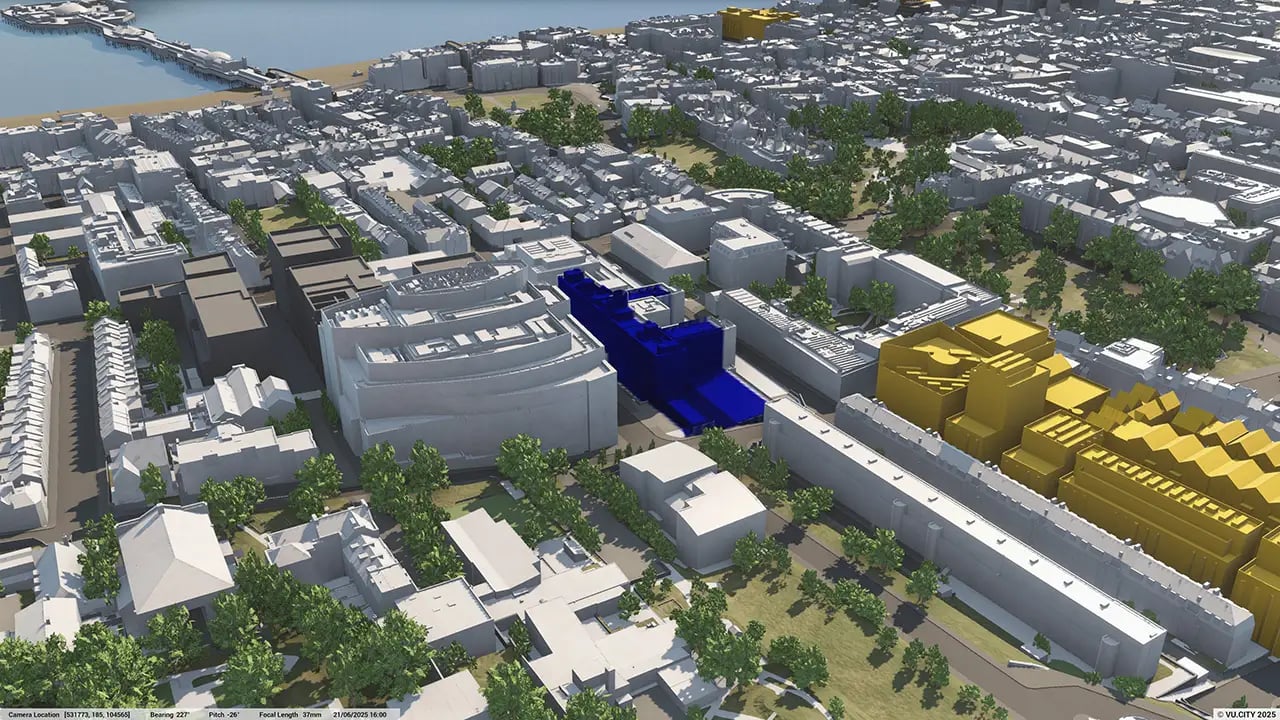
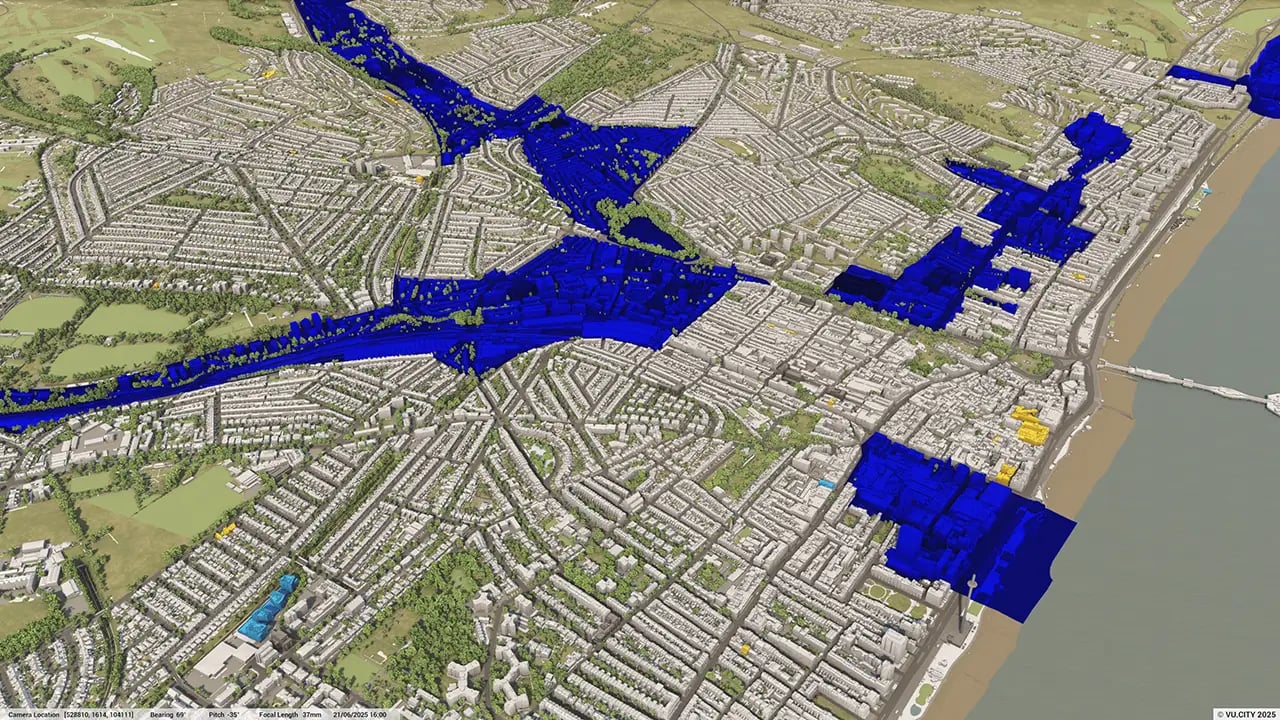
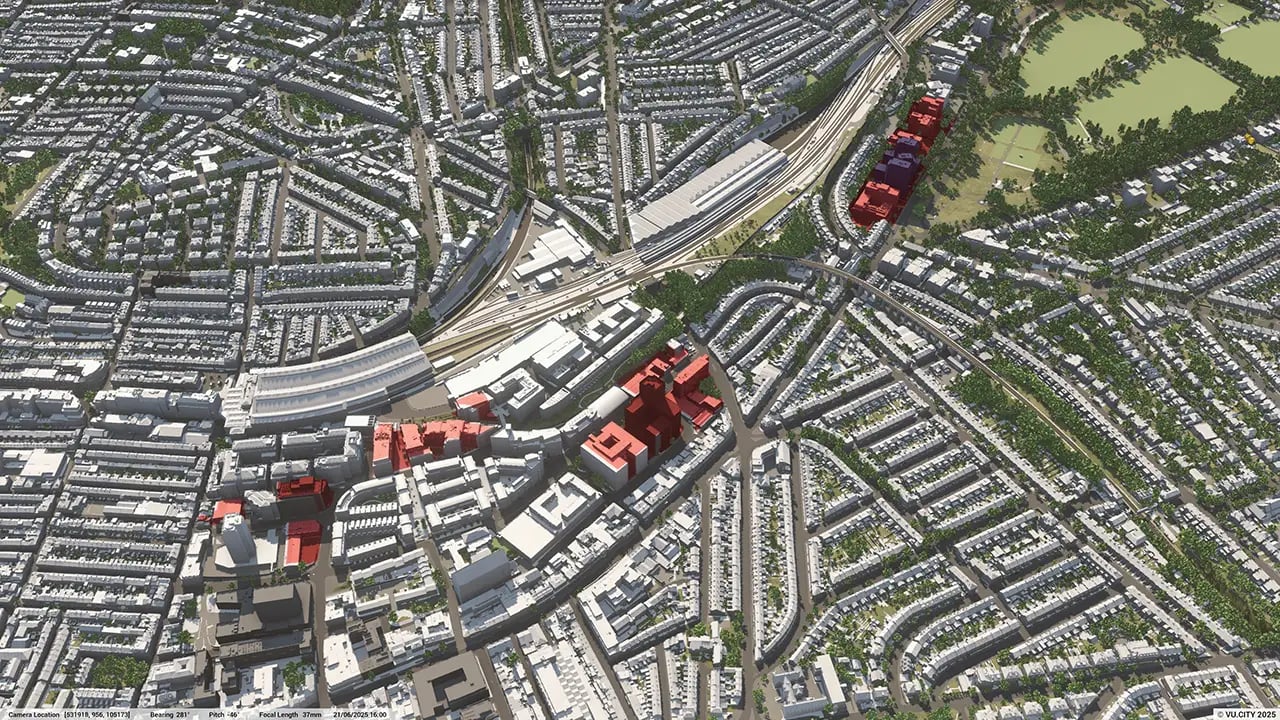
Brighton’s challenging environmental constraint requires sensitive design, particularly in the council’s identified tall building nodes and corridors. Using VU.CITY Brighton, the impact of proposals can be easily considered in context from various angles, taking strategically important views and vistas into account to protect the city’s character.
Users of VU.CITY Brighton include EPR Architects, Brighton & Hove City Council, Brooks Murray Associates, Leonard Design Architects and Hawkins\Brown, all of whom are using the model’s many benefits. From being able to understand and assess a site’s opportunities and challenges, testing designs in context, enhancing pre-app conversations and planning submissions, to improving how everyone involved collaborates.
Trusted by 6,000+ users across 26 cities
Architects, developers, local authorities, urban planners, and more trust VU.CITY to help achieve their goals.
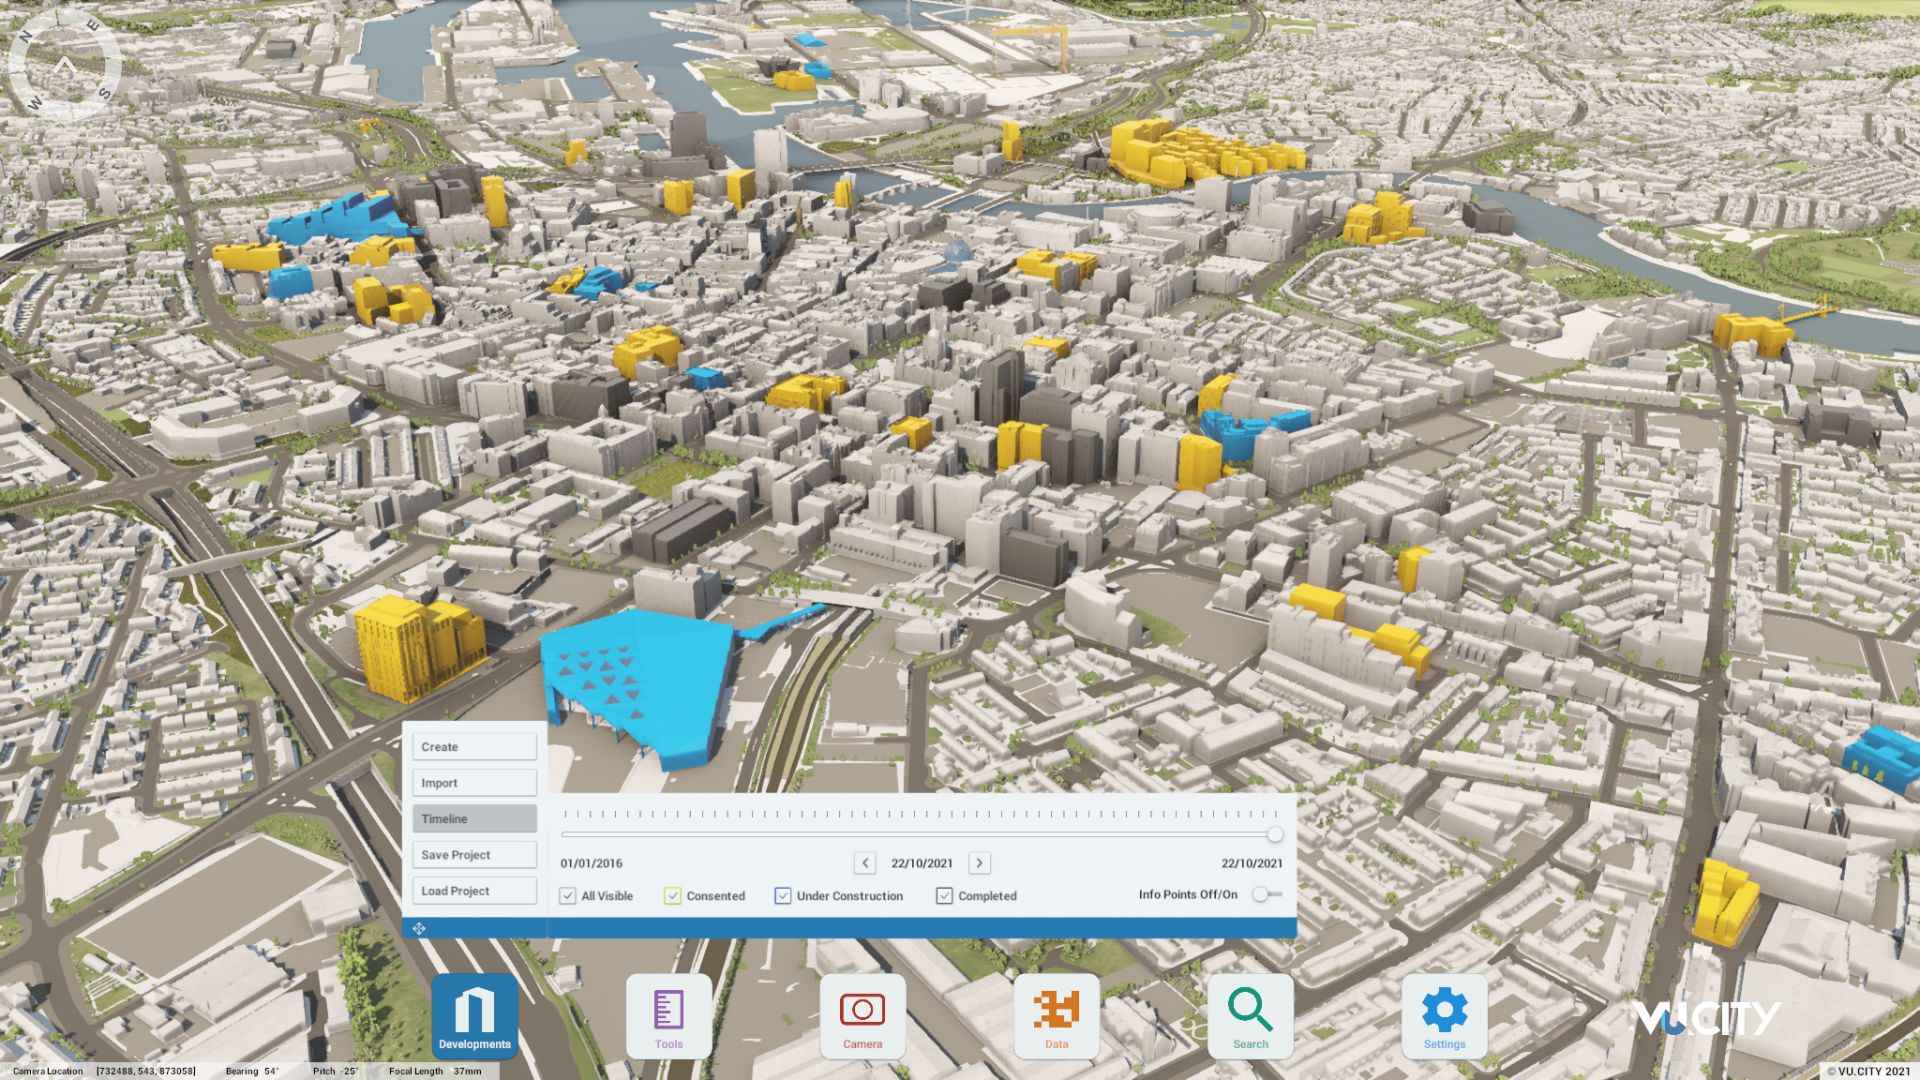
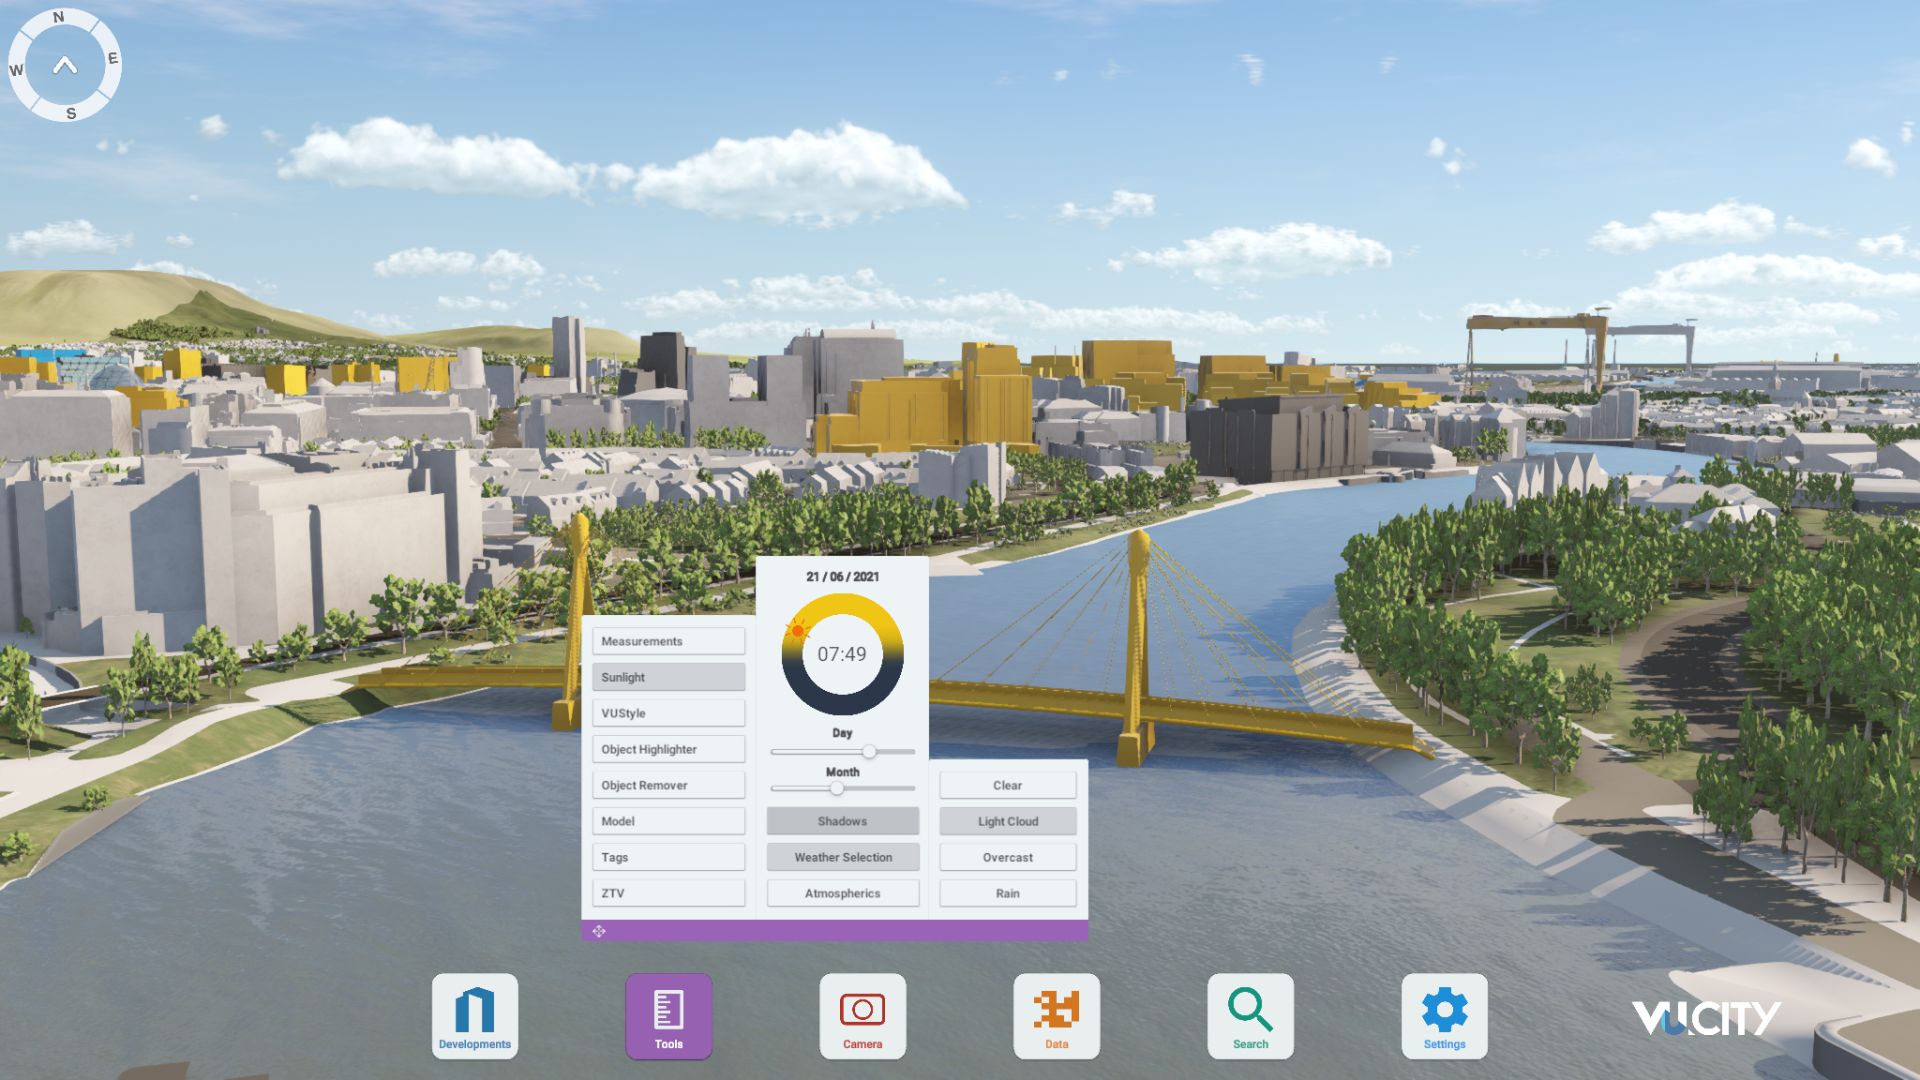
Organise and visualise your geospatial data in accurate context with our comprehensive suite of digital design and development tools.
VU.CITY Brighton: 3D Model Features and Planning Tools
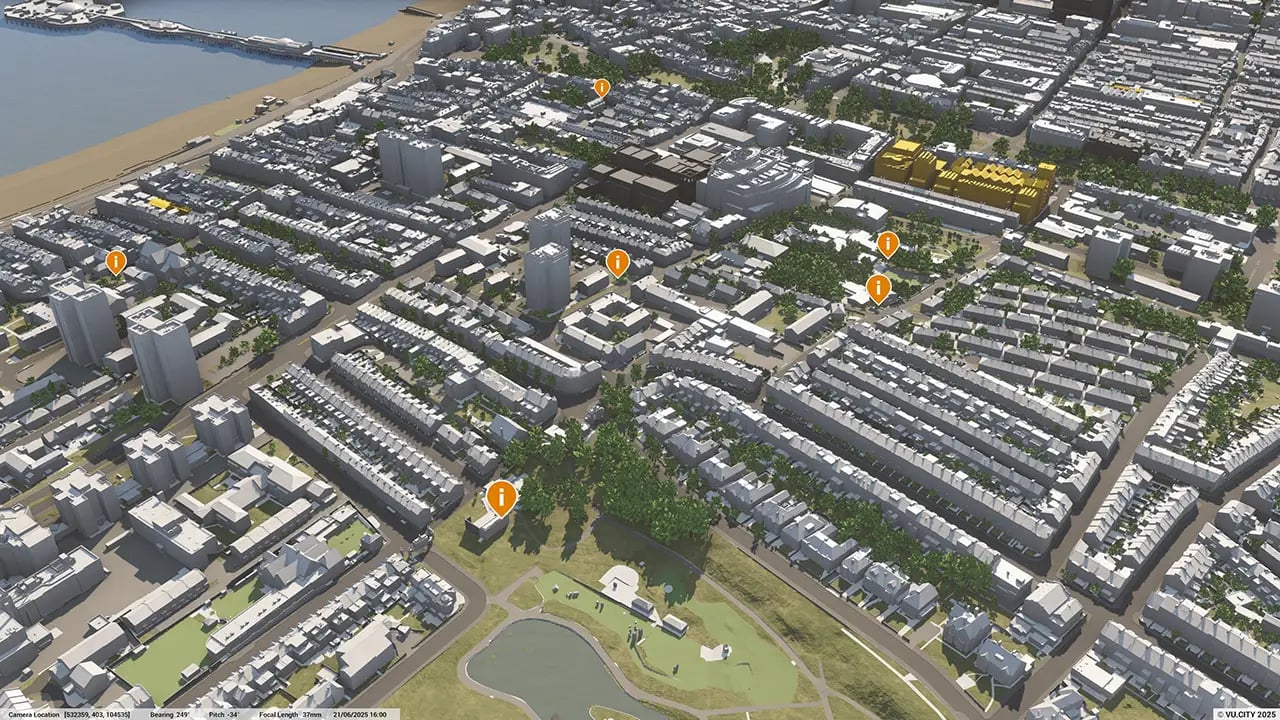
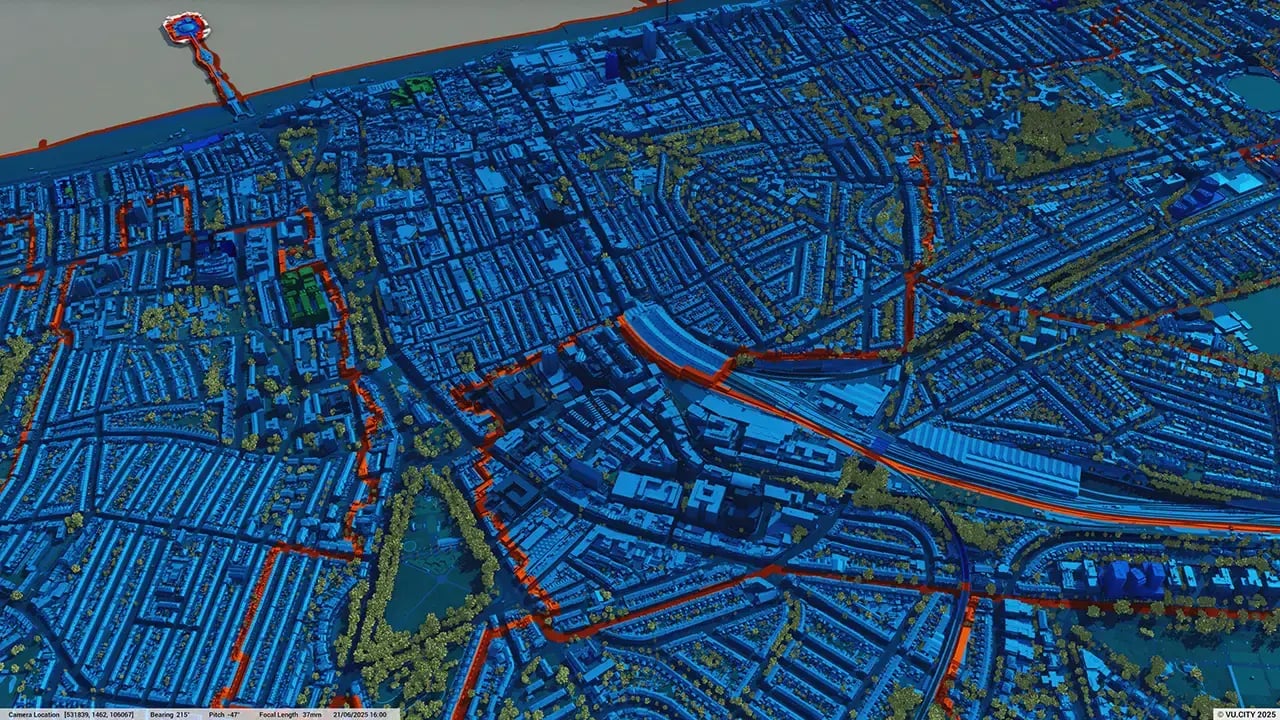
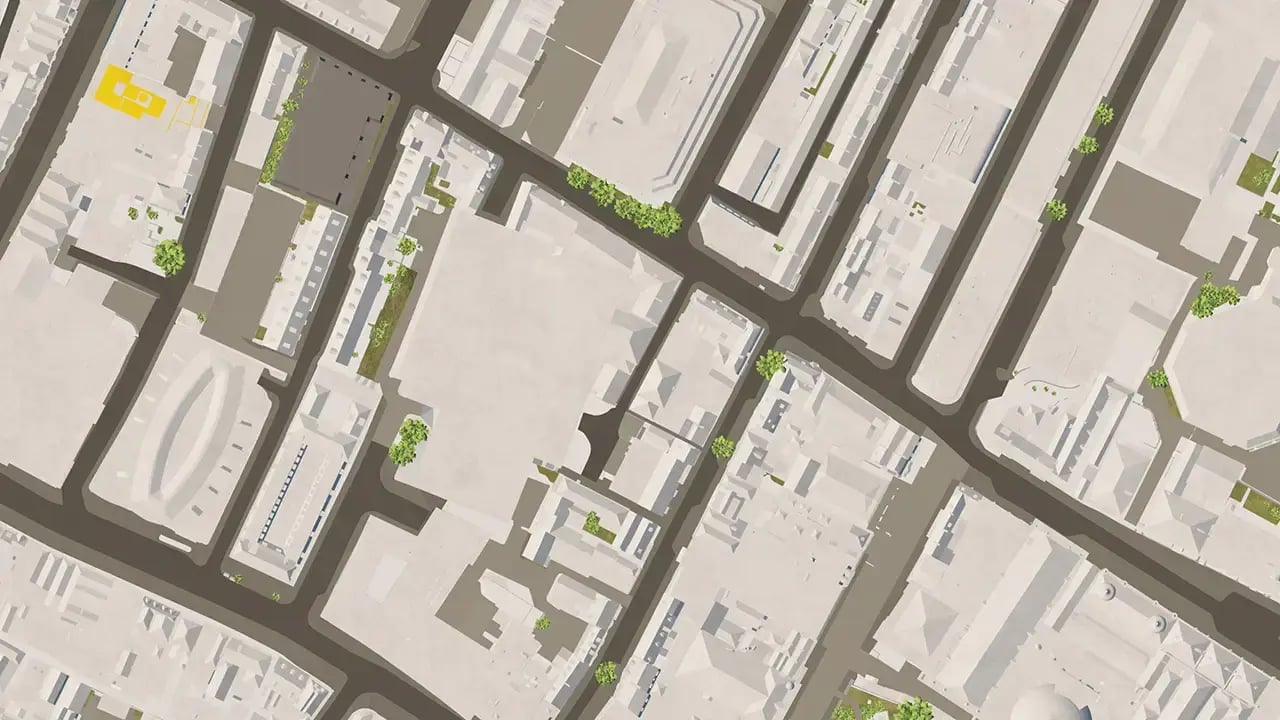
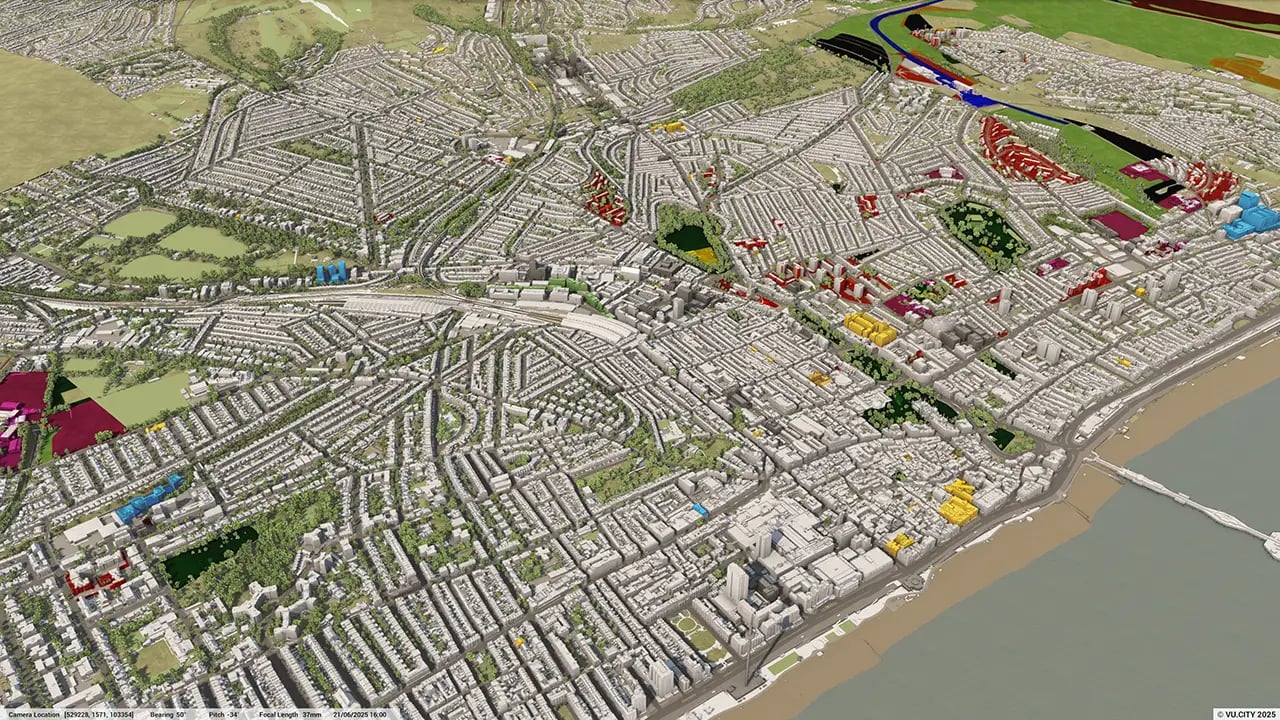
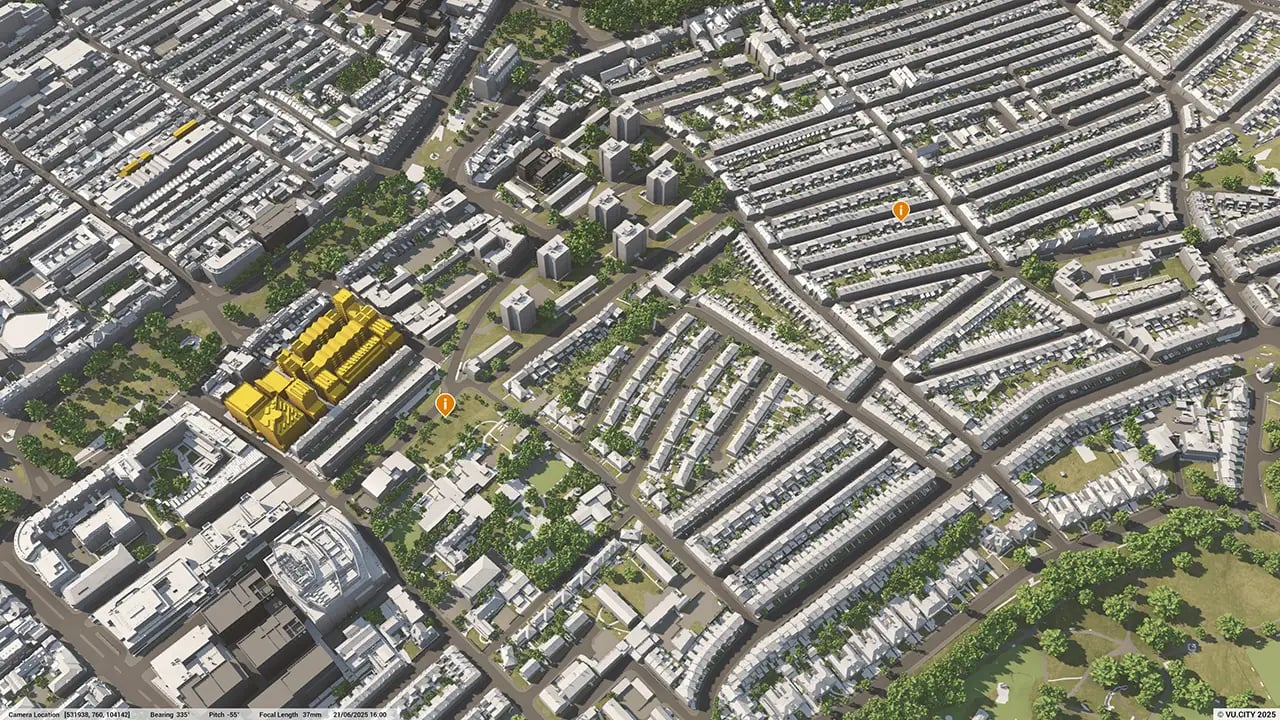
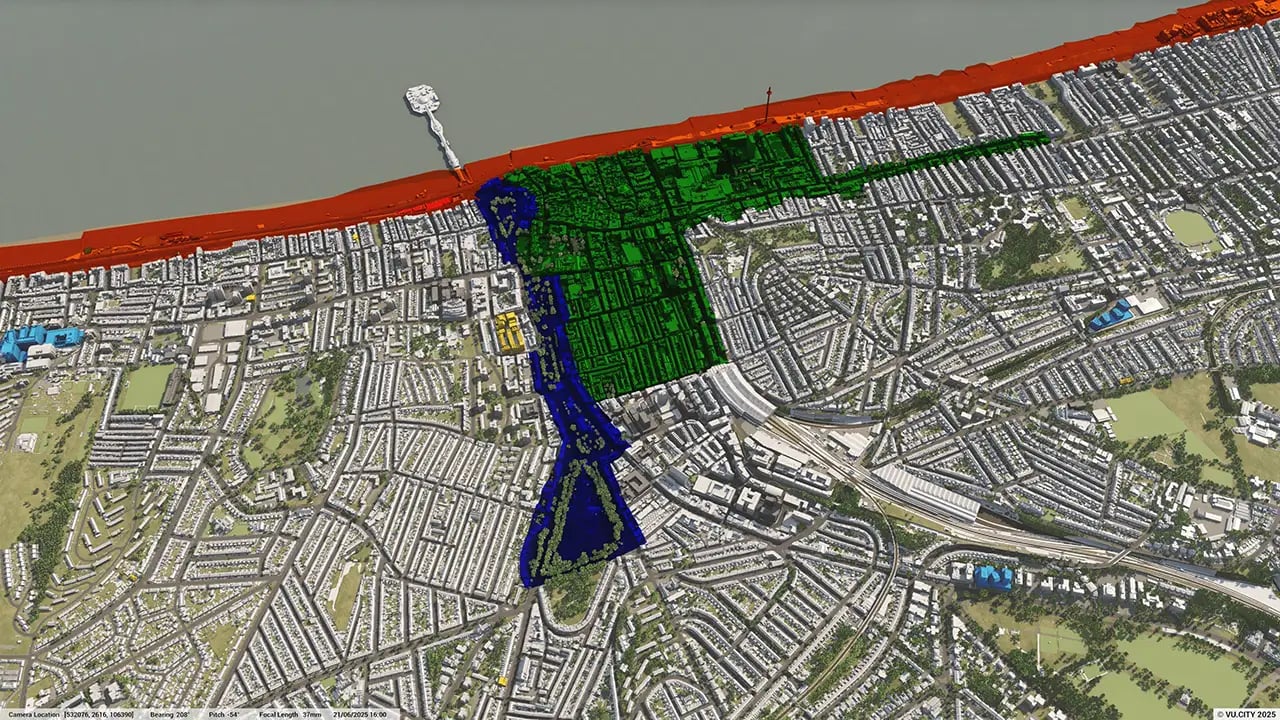
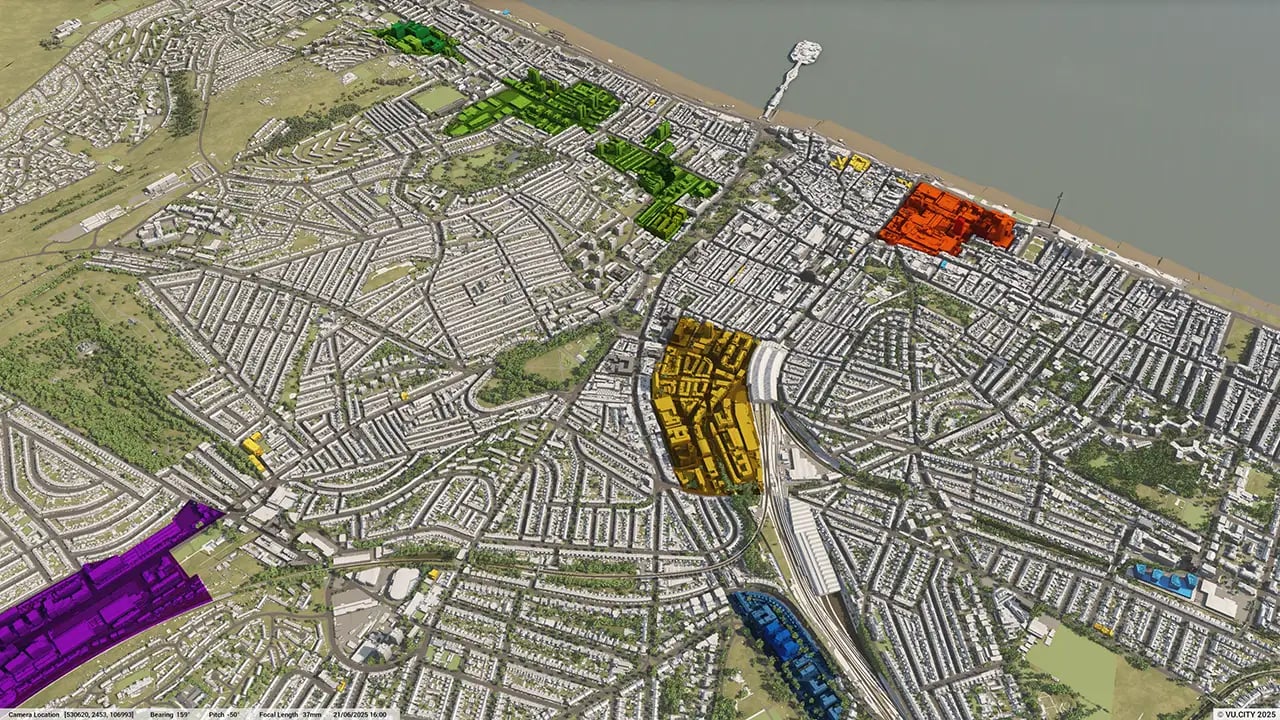
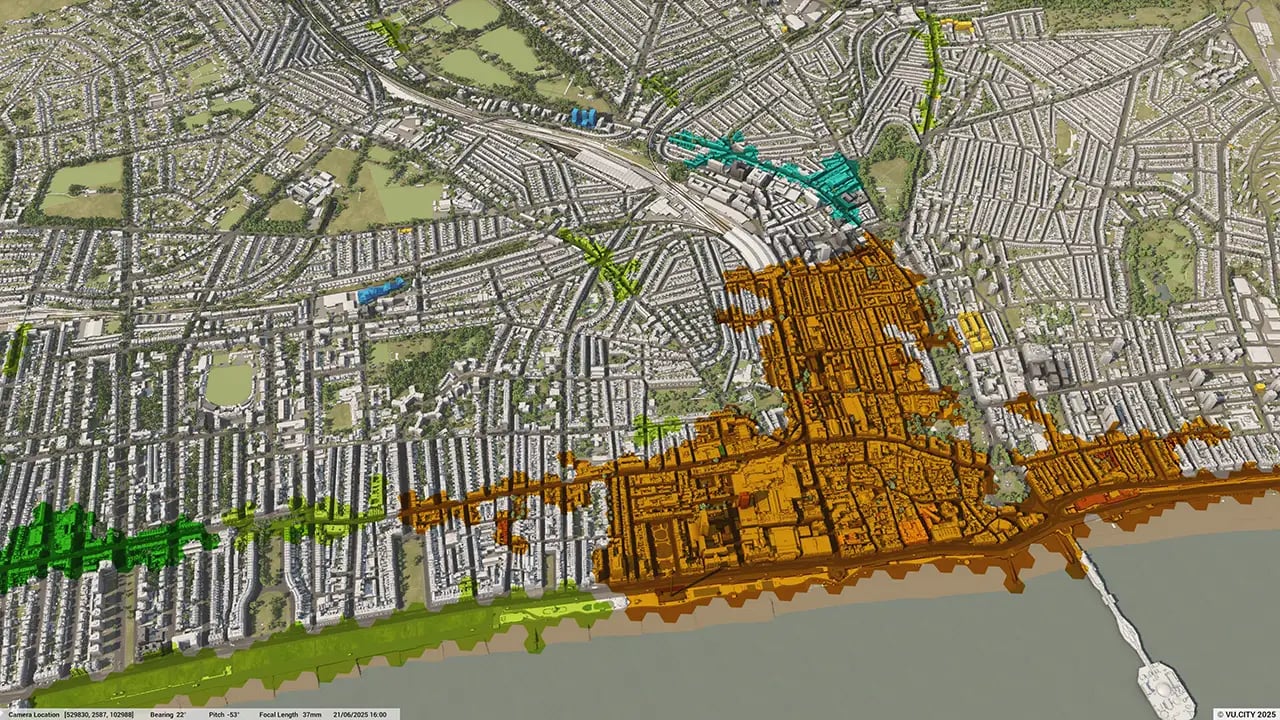
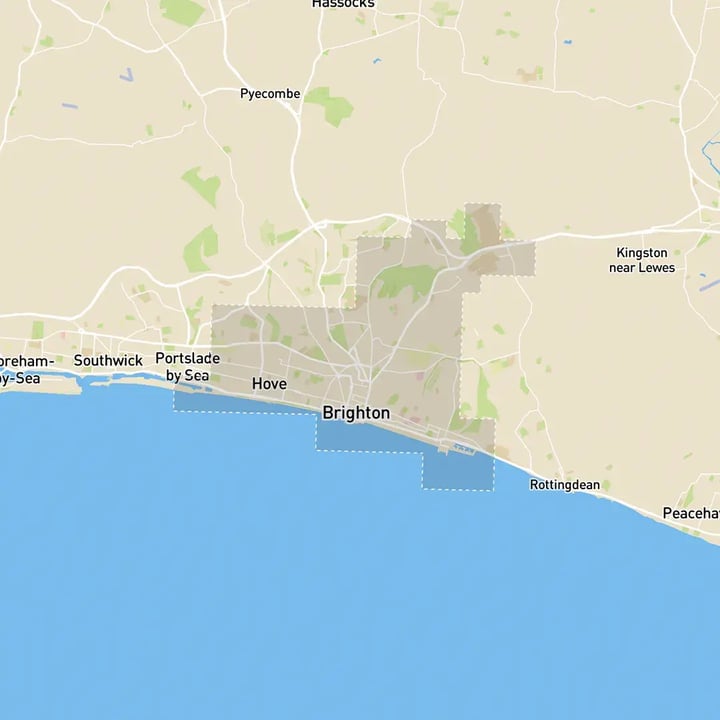
Brighton 3D tile coverage
Whether you’re focusing on a single neighbourhood or the entire cityscape, VU.CITY provides full coverage with unmatched precision.
VU.CITY Brighton FAQs
Here are some frequently asked questions about VU.CITY's Brighton 3D Digital Twin and Model
How can the VU.CITY Brighton model assist with planning in a constrained coastal city?
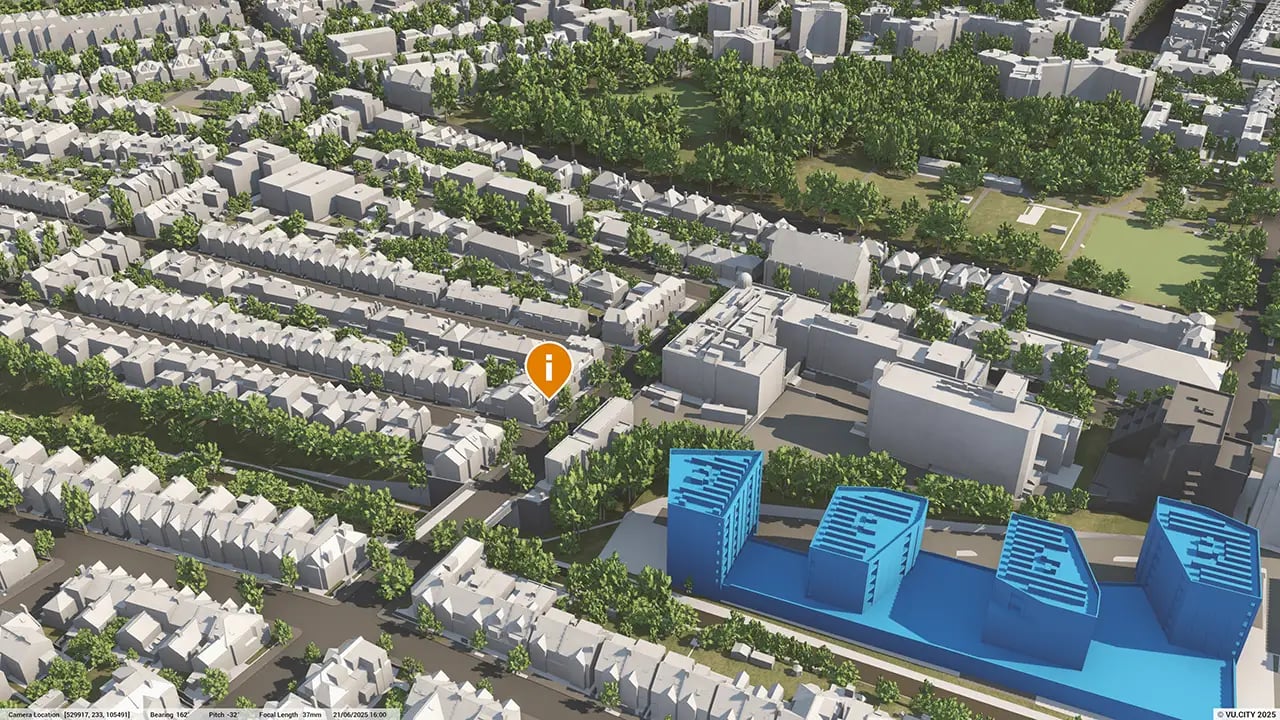
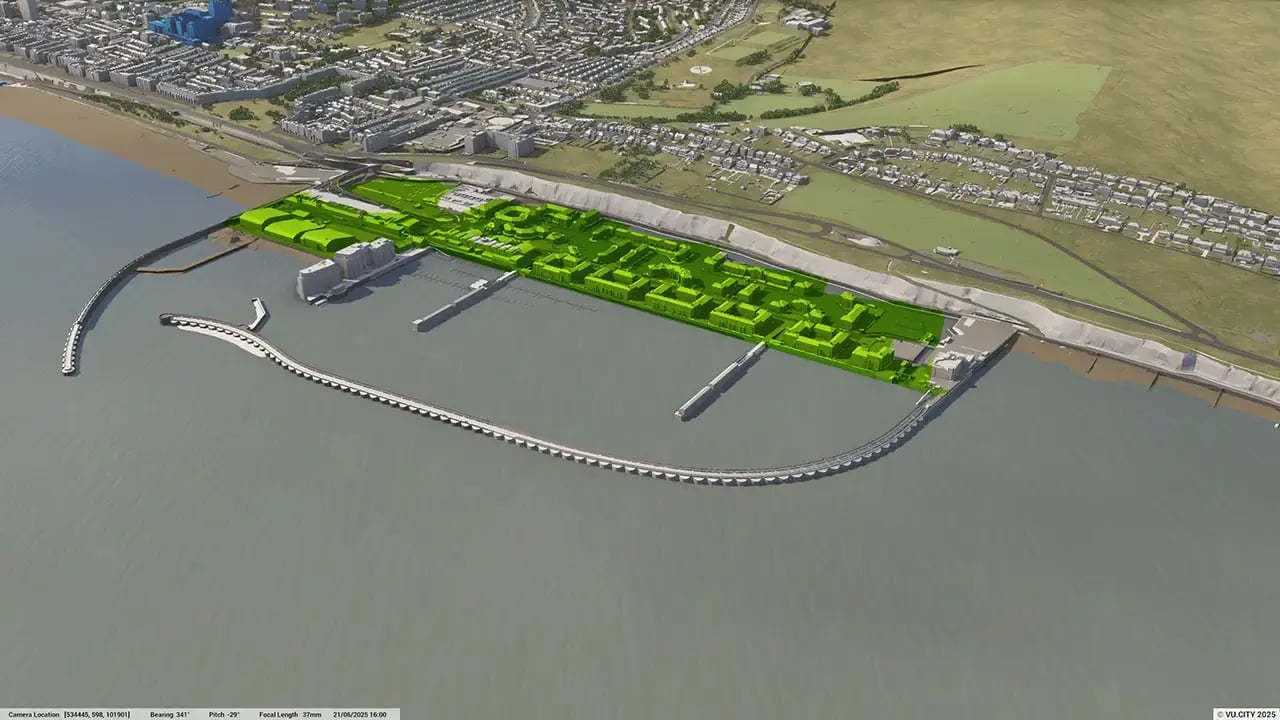
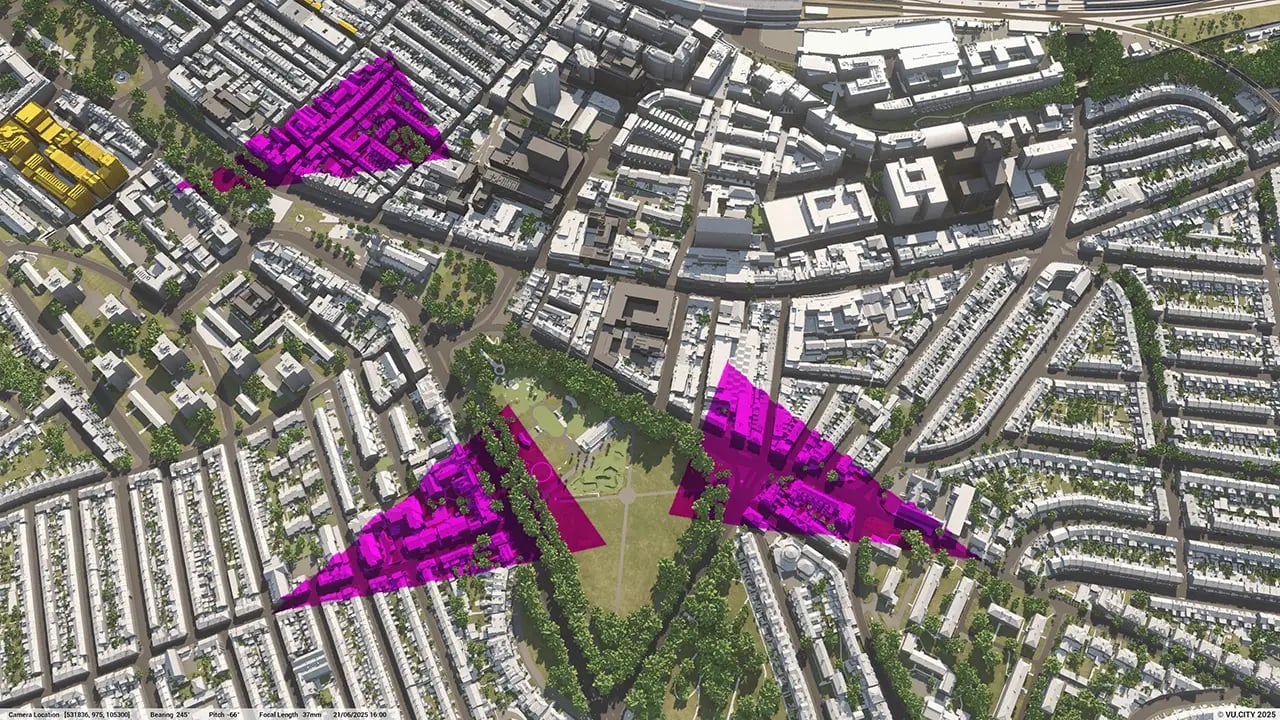
The Brighton model helps users assess developments in a compact area bounded by the South Downs and the sea. Tools like view impact analysis and massing studies support informed planning that respects Brighton’s unique landscape and character.
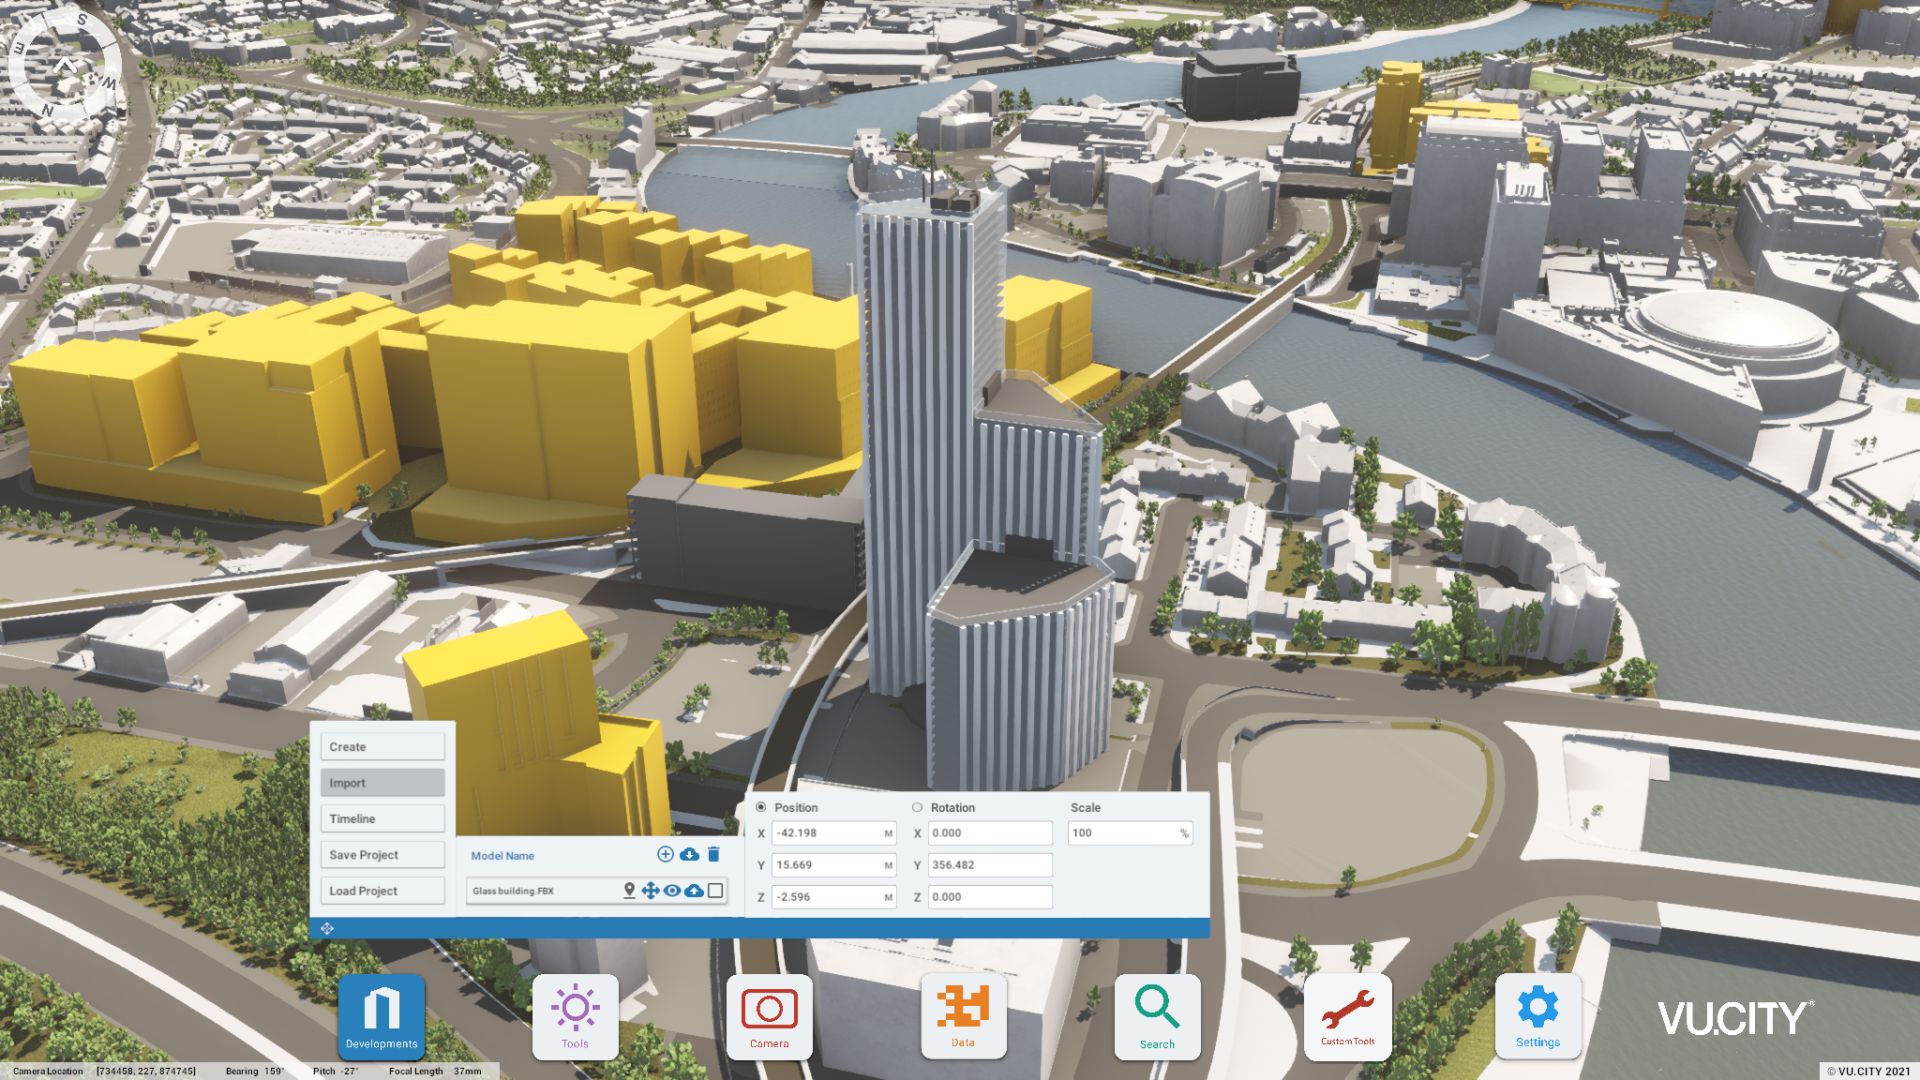
Can the Brighton 3D model help with testing different design options in sensitive areas?
Yes, the model enables users to test multiple massing options, especially in areas with tall building guidelines. This ensures that new developments fit within Brighton’s designated nodes and corridors without compromising strategic views.
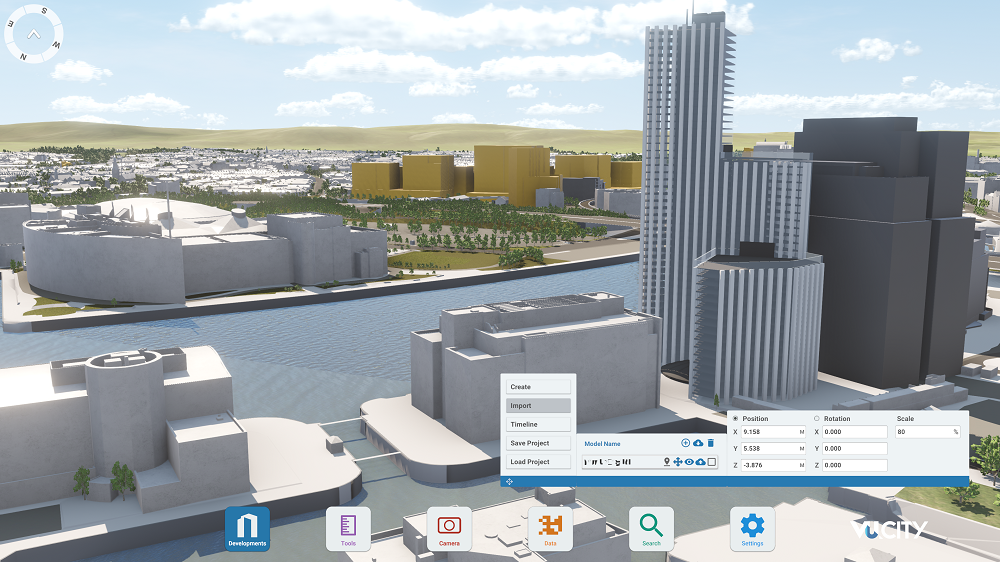
How does the VU.CITY Brighton model enhance stakeholder and community engagement?
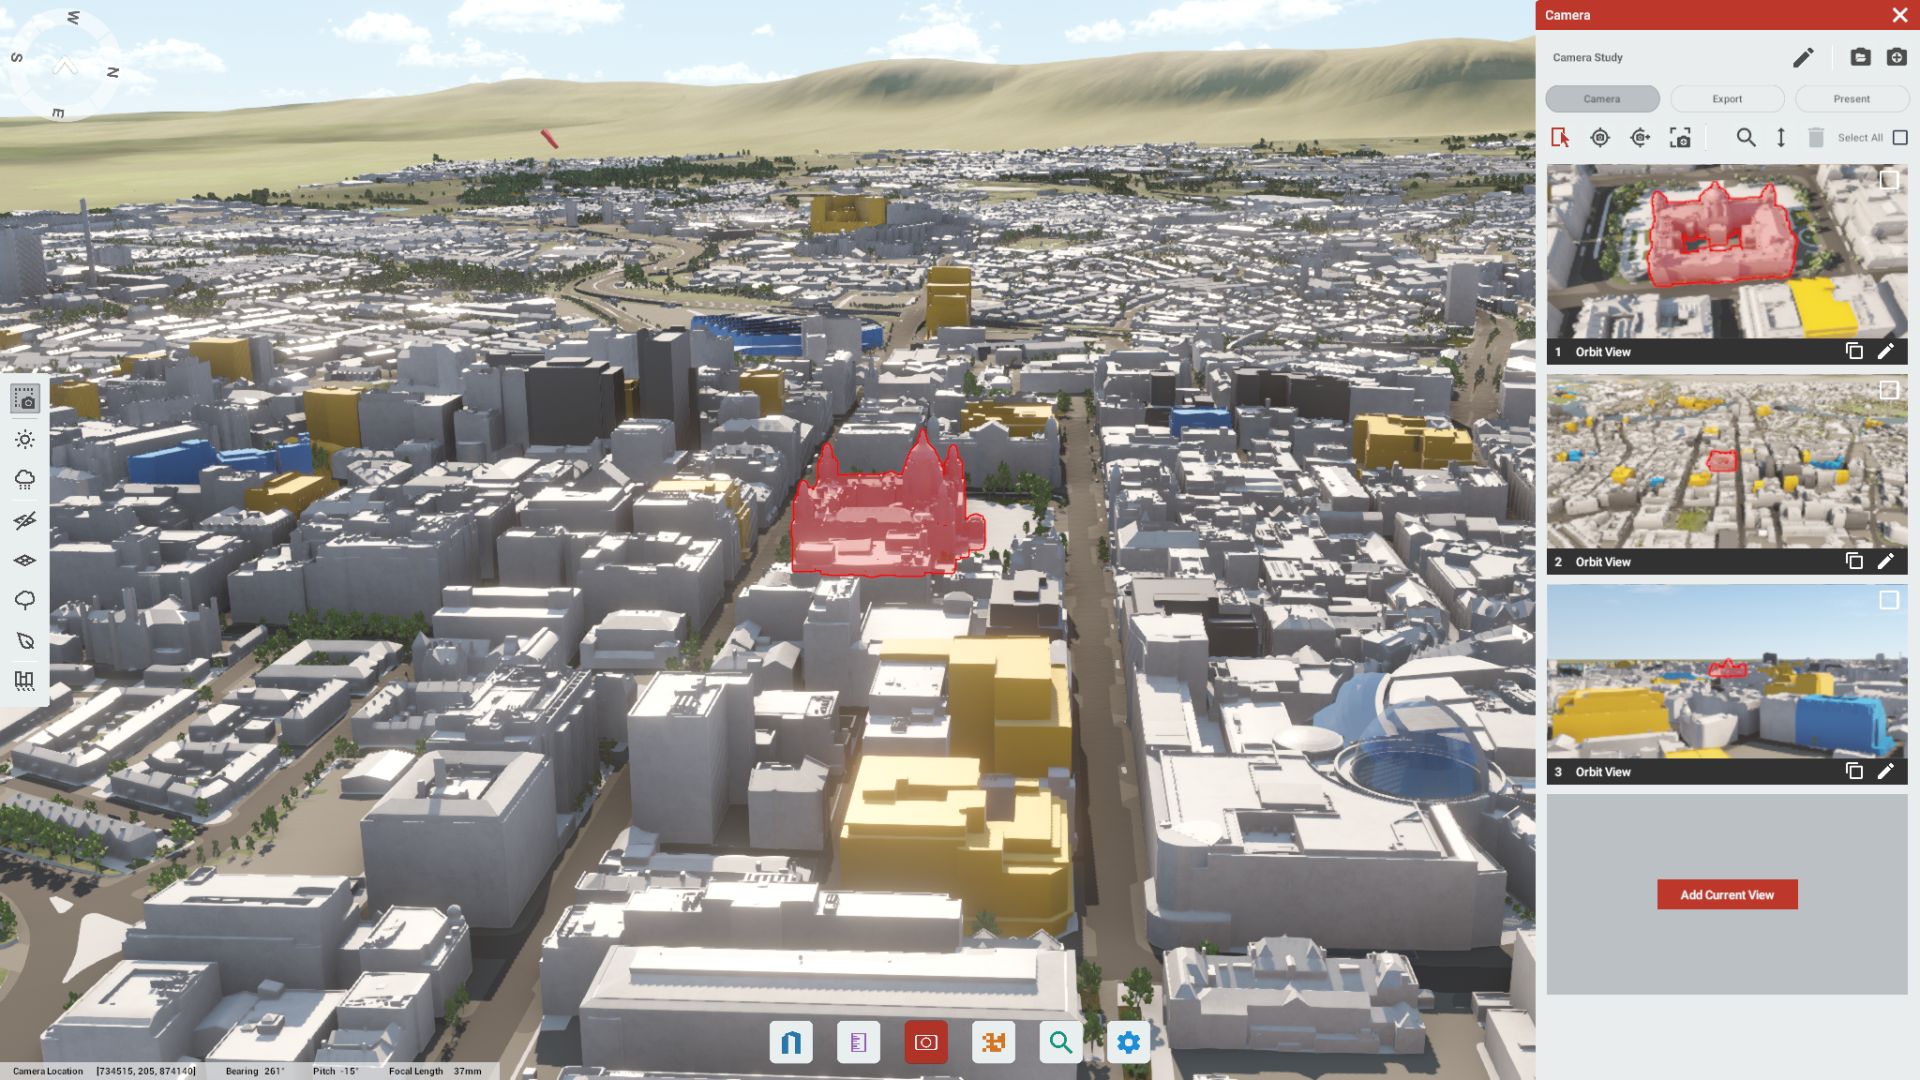
Features like the Camera Tool and its views enable users to create compelling visual presentations. This helps clearly communicate design impacts to stakeholders and community members, building support and facilitating feedback.
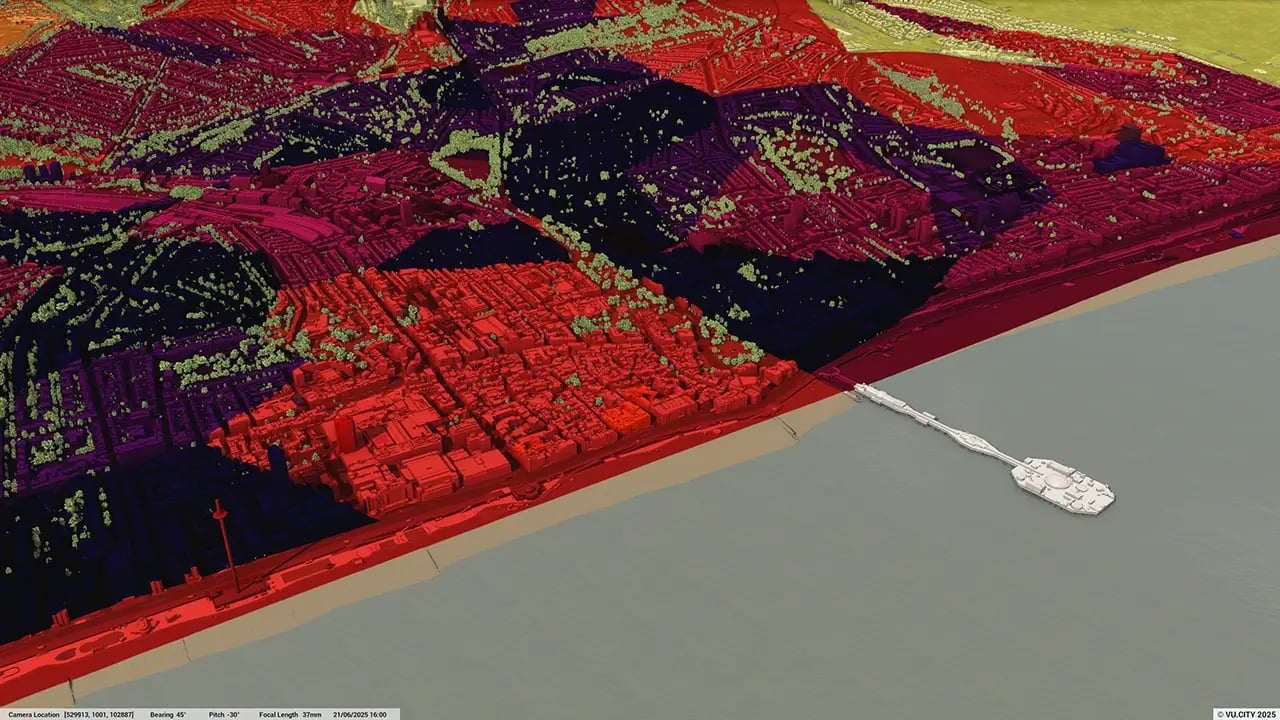
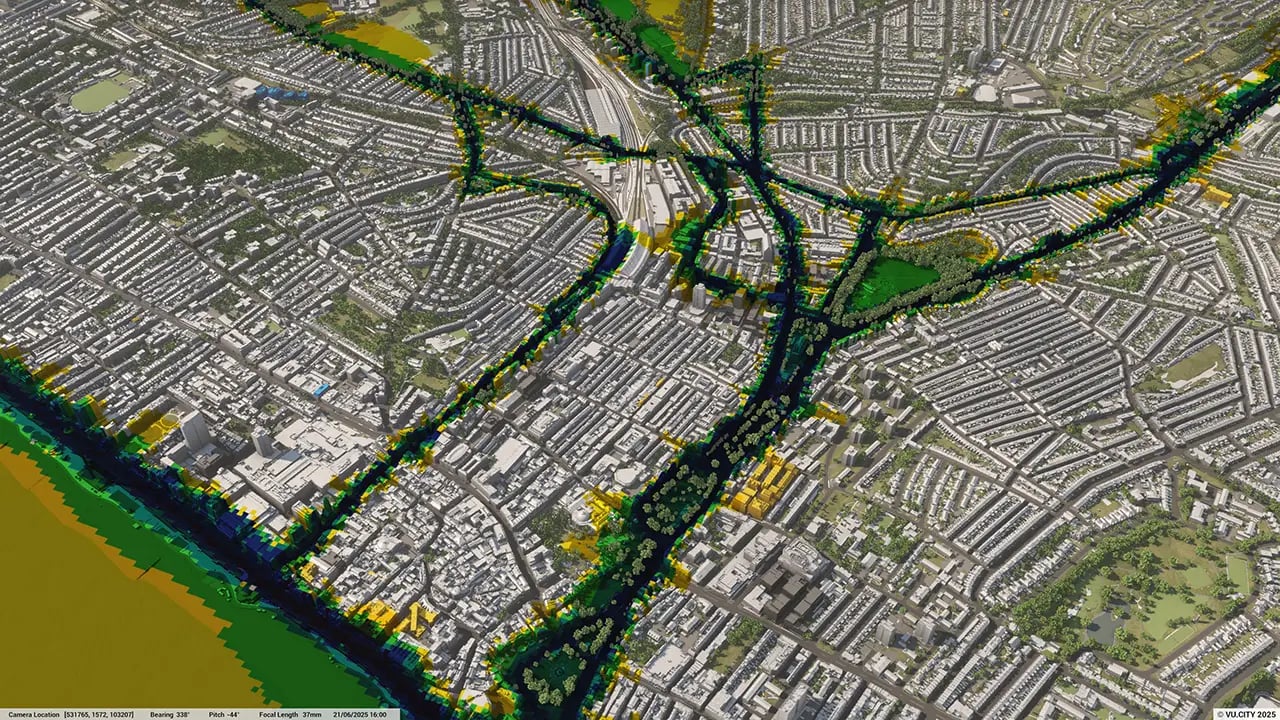
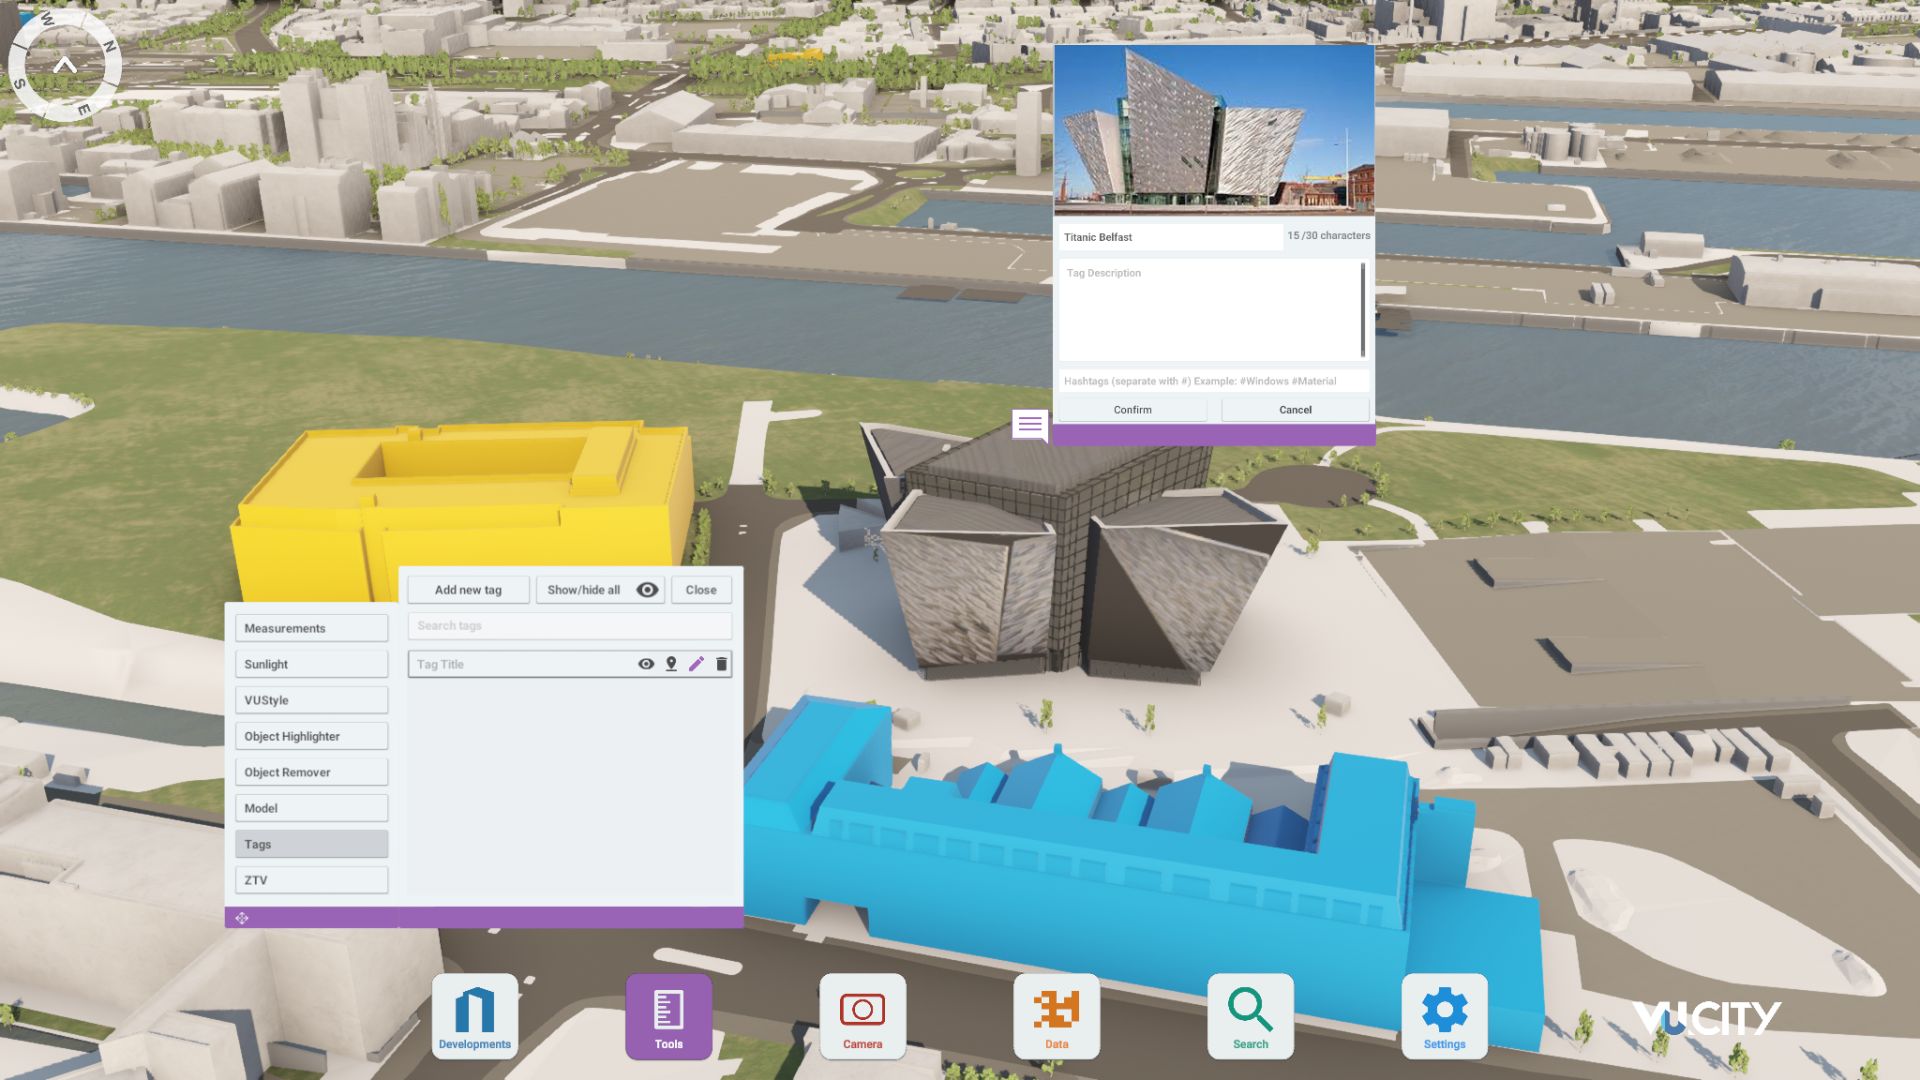
What environmental and heritage data layers are available in the Brighton model?
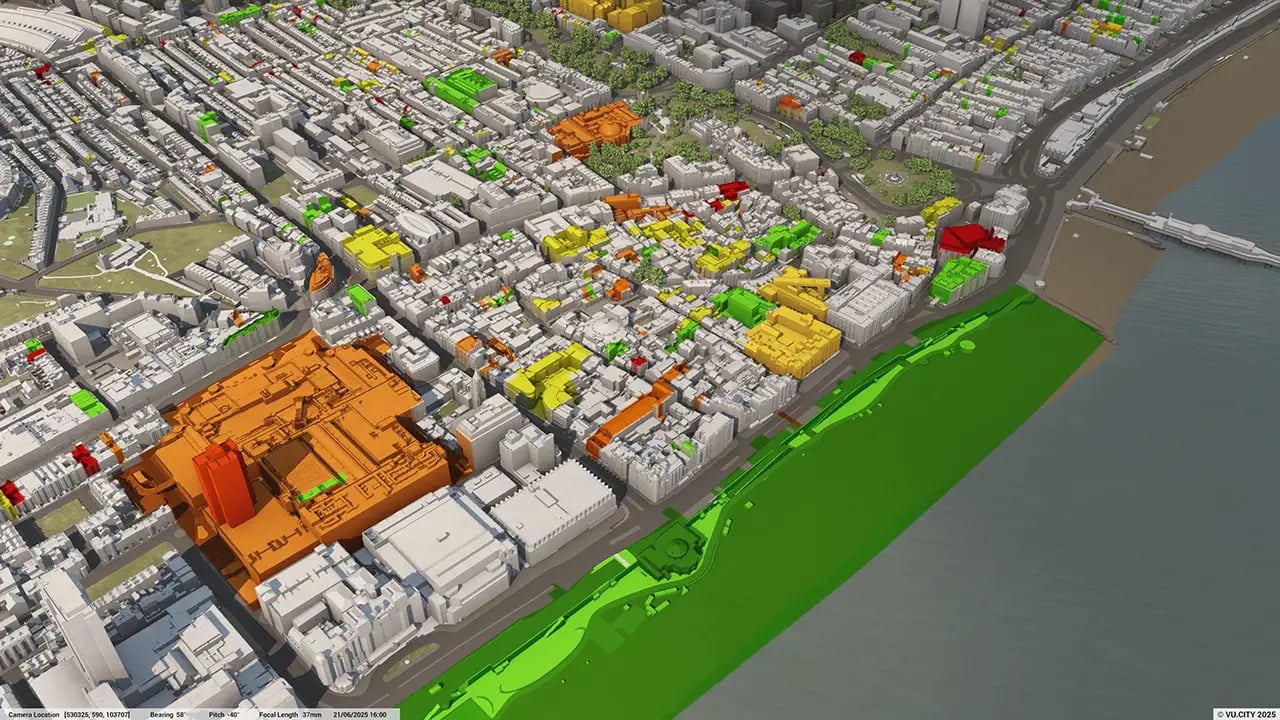
The model includes layers for conservation areas, listed buildings, sunlight analysis, and greenbelt boundaries, supporting environmentally responsible planning that aligns with Brighton’s local regulations and preservation efforts.
Who benefits from using the VU.CITY Brighton model?
Architects, planners, developers, and local authorities benefit from the model. It facilitates collaboration, supports responsible development, and ensures that new projects align with Brighton’s goals for sustainable growth and heritage protection.
Explore digital 3D geospatial solutions for the built environment
VU.CITY provides clear, powerful tools for key decision-makers across the built environment, helping them visualise and shape the future of cities with confidence and precision.
Make smarter decisions with data-driven insights, from infrastructure to sustainability.
Unlock the power of Generative AI for optimal design and streamlined decision-making.
Bring your designs to 3D life with state-of-the-art modelling tools.
Collaborate seamlessly across studies, planning, and design.
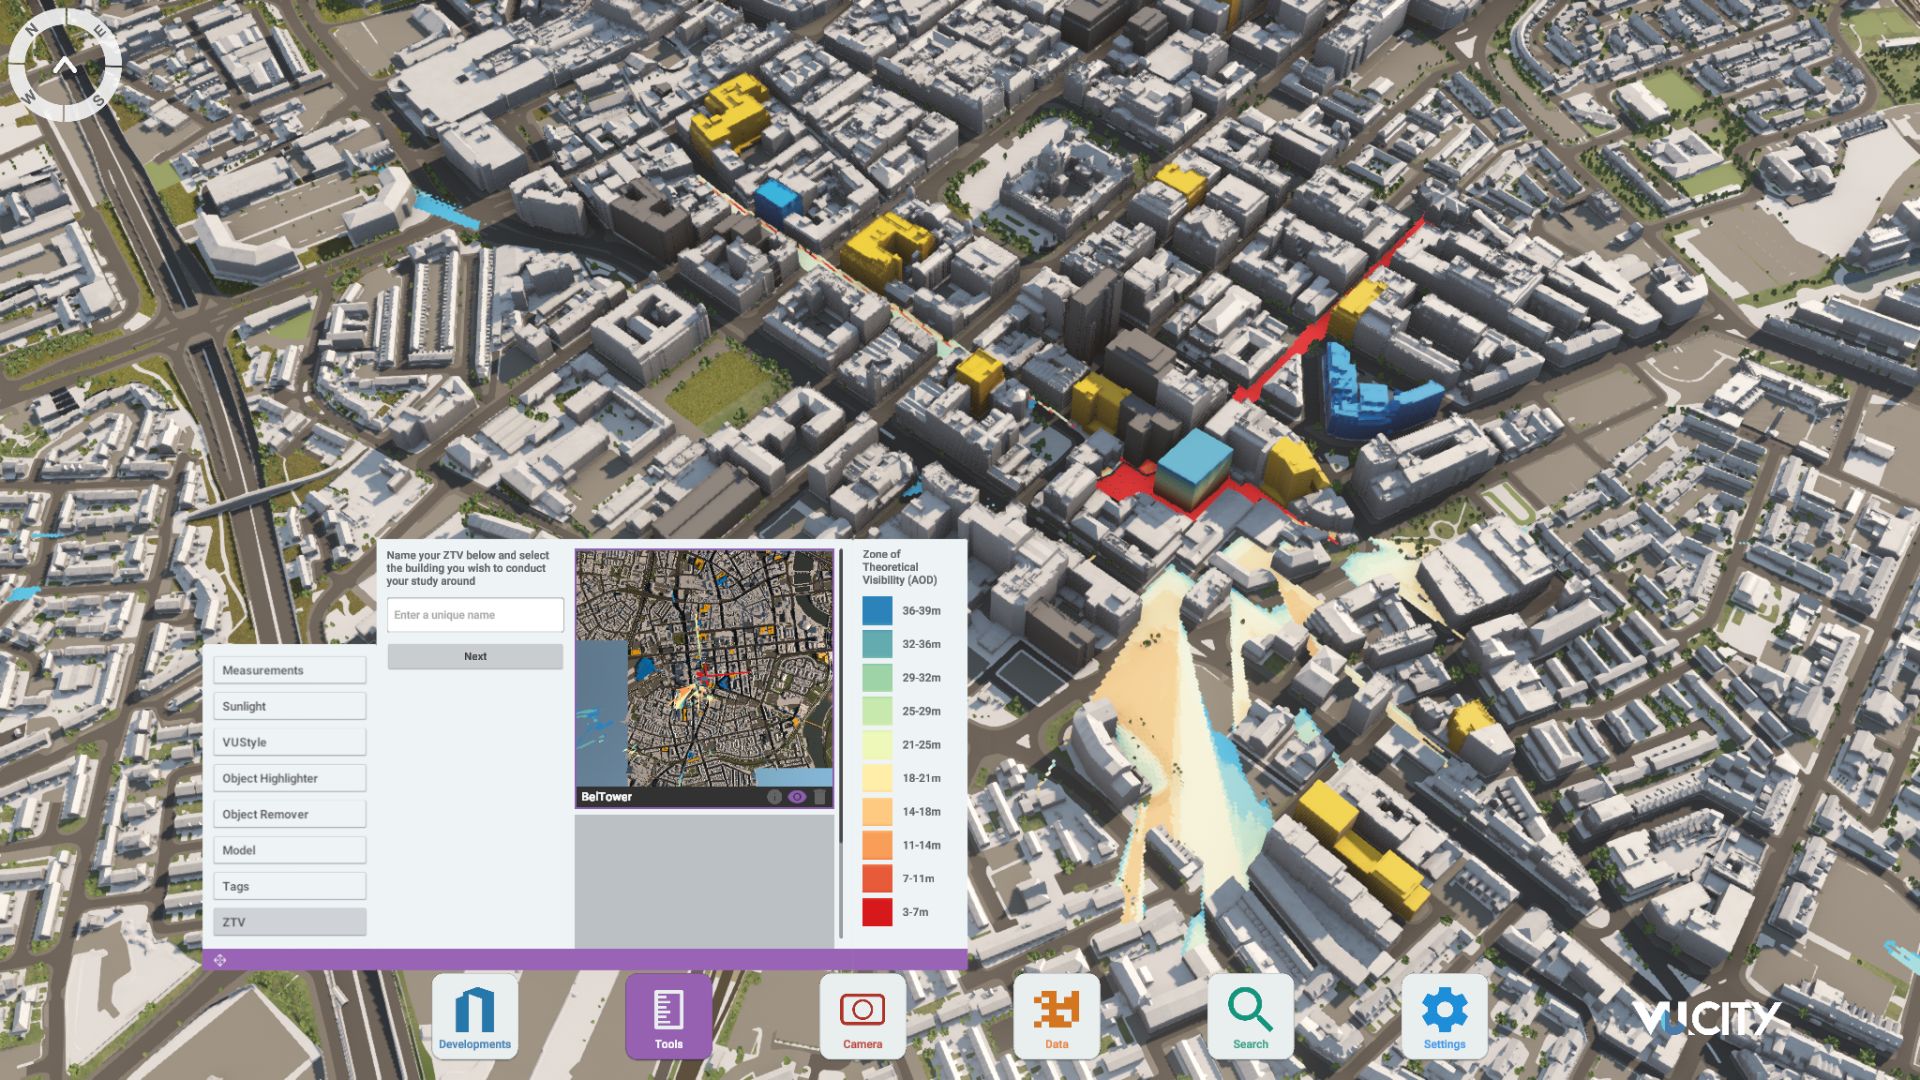
Utilise advanced 3D models and a data-driven approach with our flexible ZTV service.
Bring Your Vision to Life with a 3D Flythrough Video.
26 UK & International Cities
Over 3,000+ sq km accurate to 15cm | Tools to scope, create & collaborate on designs
Shape Tomorrow’s Cities, Today.
Begin Your Free Trial Now.