Birmingham 3D Model
Reduce uncertainty with our Birmingham 3D Model. Tap into comprehensive data layers to minimise planning risks, anticipate potential impacts, and speed up critical decisions.
With VU.CITY’s precise and immersive Birmingham digital twin platform, teams collaborate effortlessly, driving smarter outcomes and boosting planning success.
-
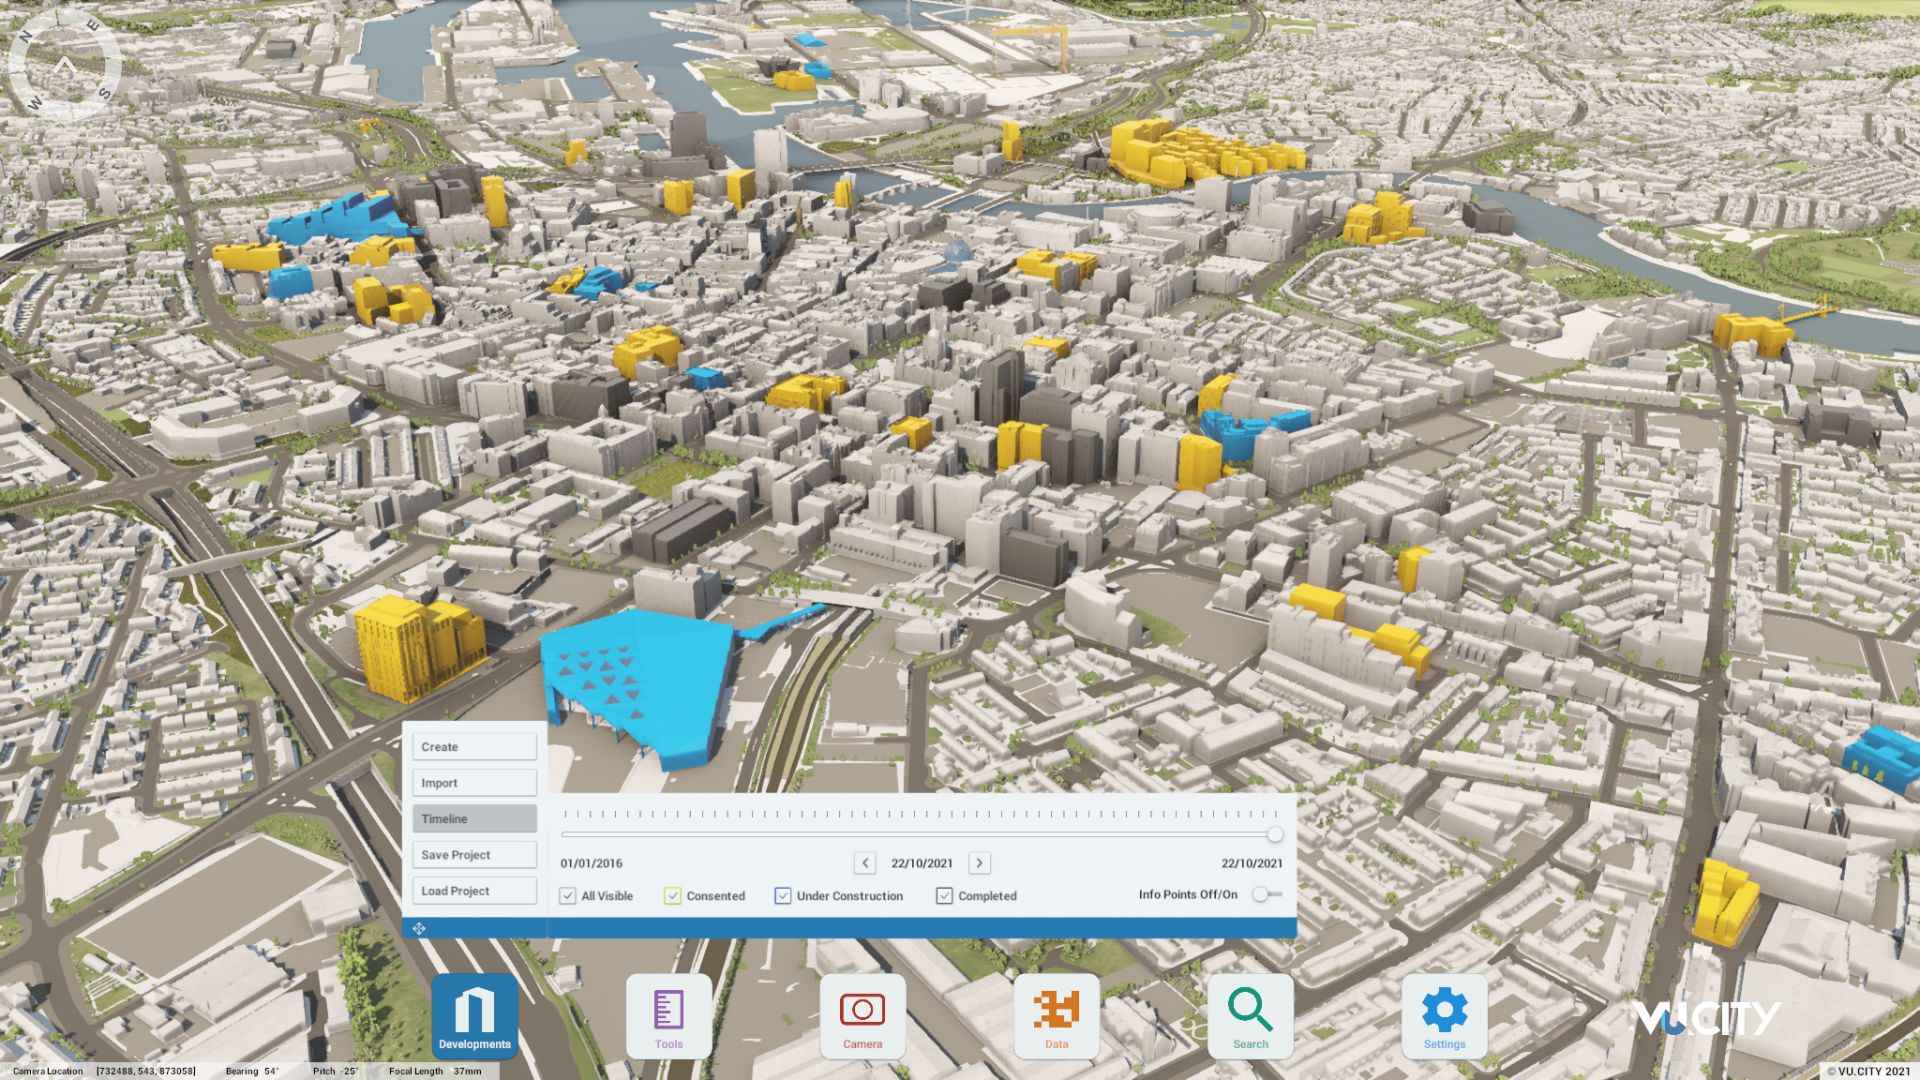
36DATA LAYERS
-
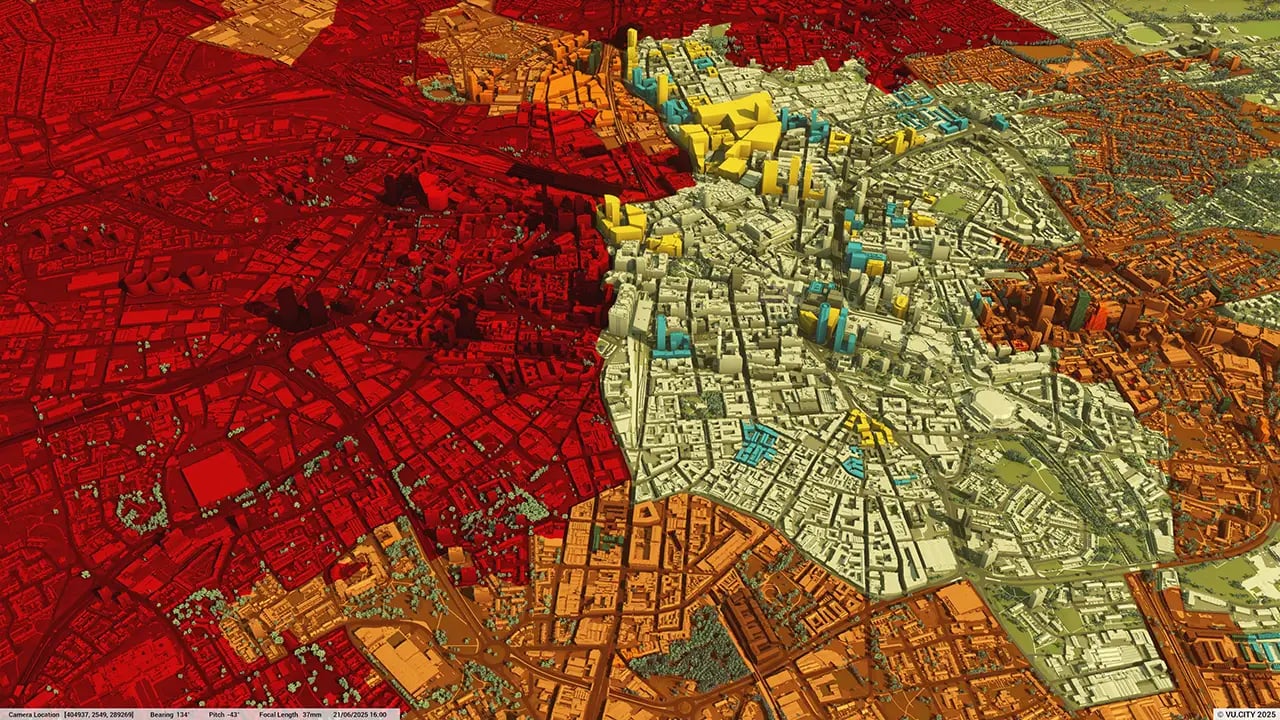
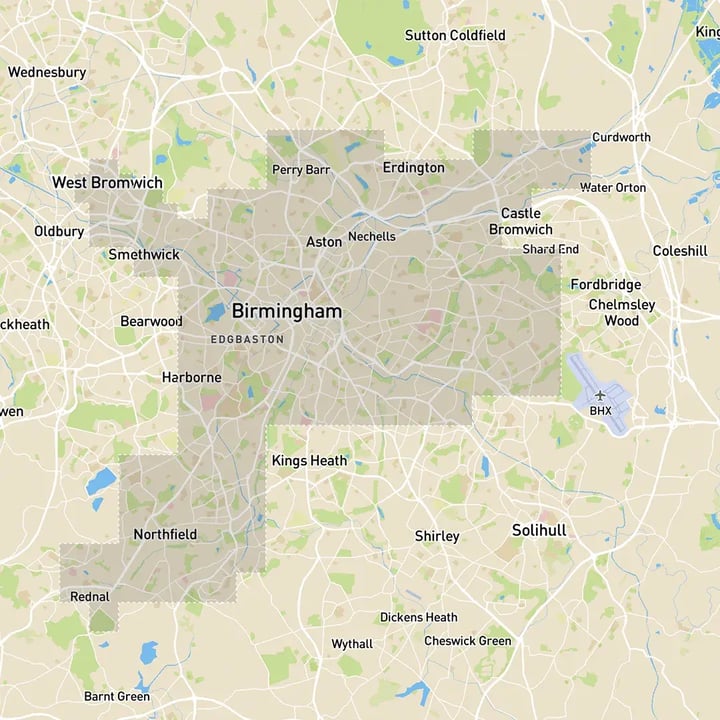
157.25 sq kmMODELLED TO 15CM ACCURACY
-
293Consents approved VU.CITY
-
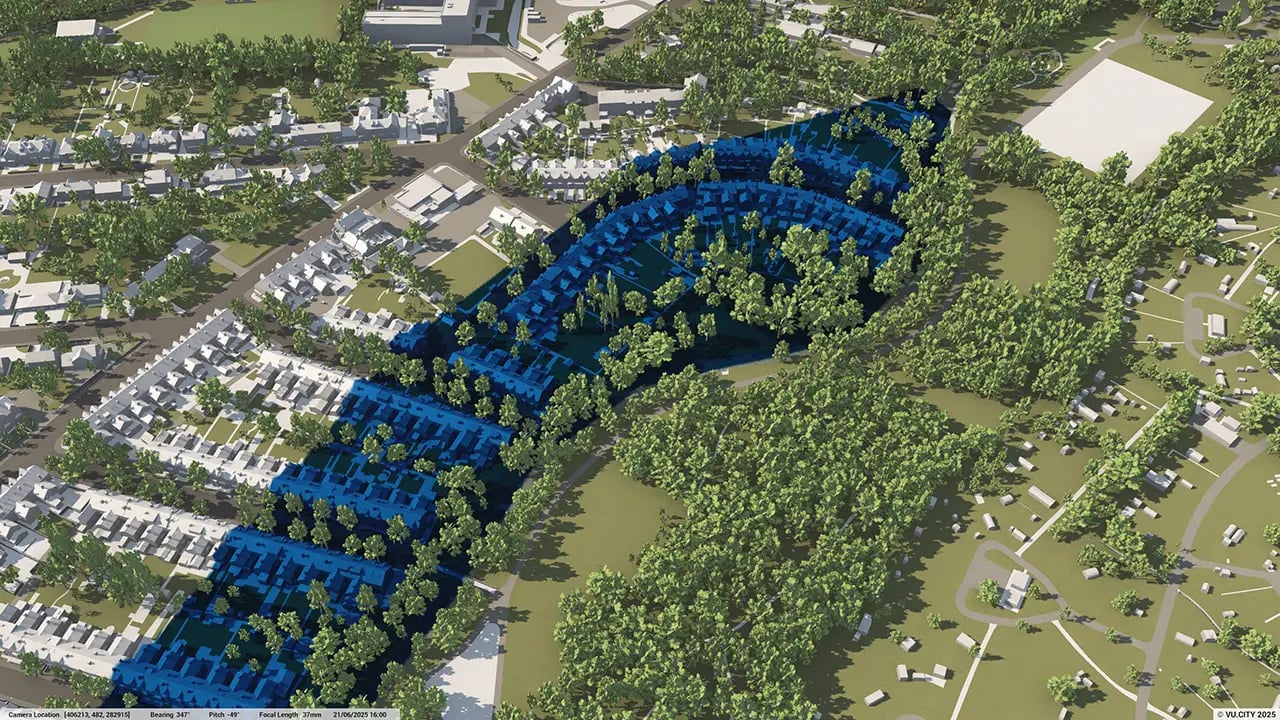
615,669TREES, ACCURATE HEIGHT AND CANOPY

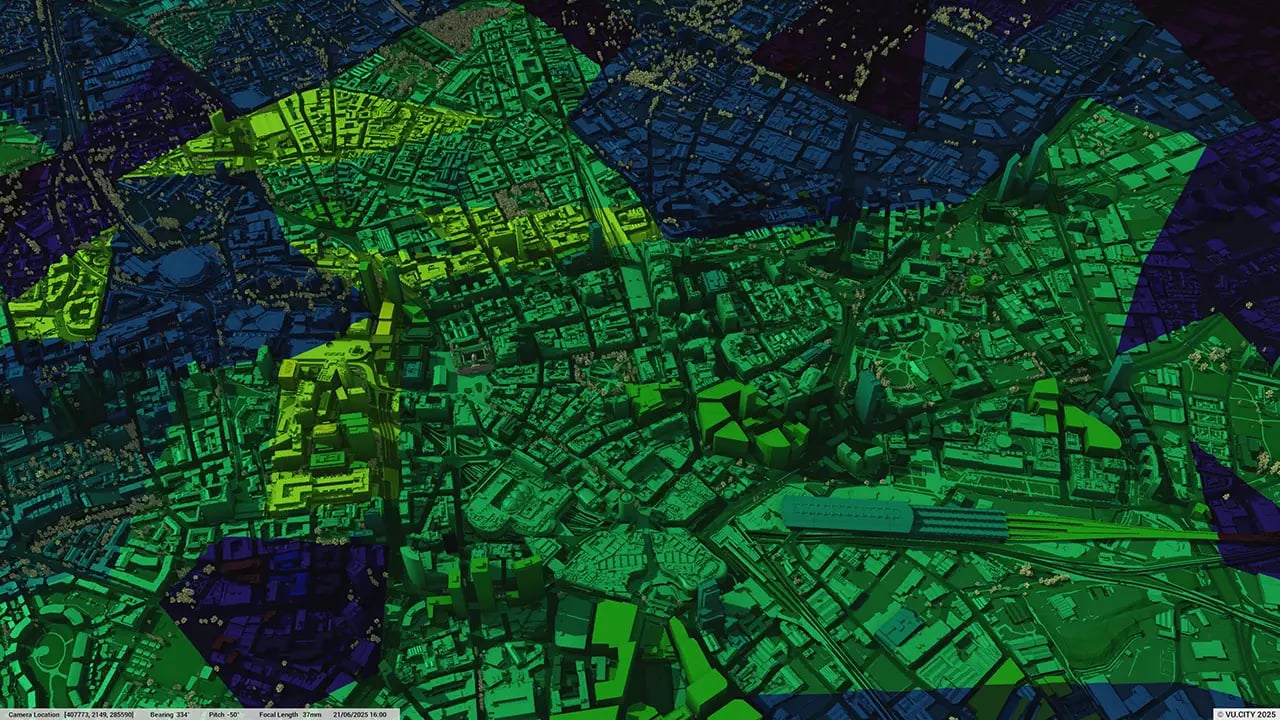
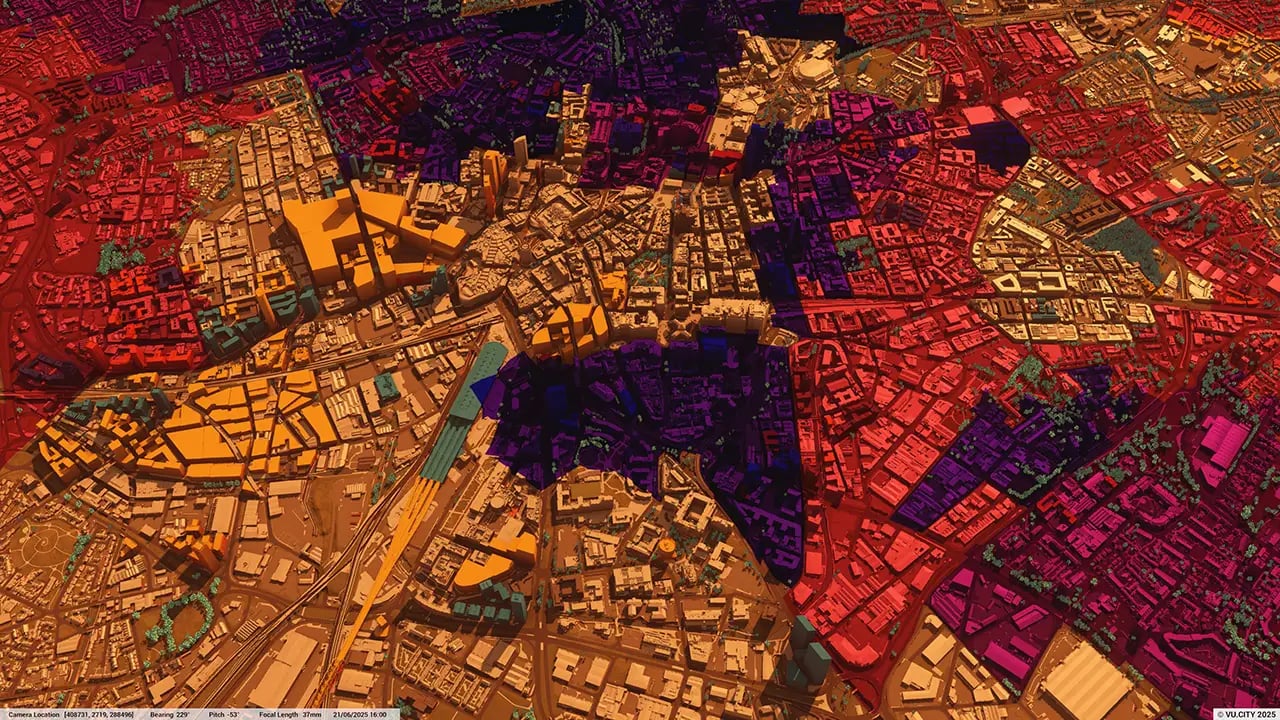
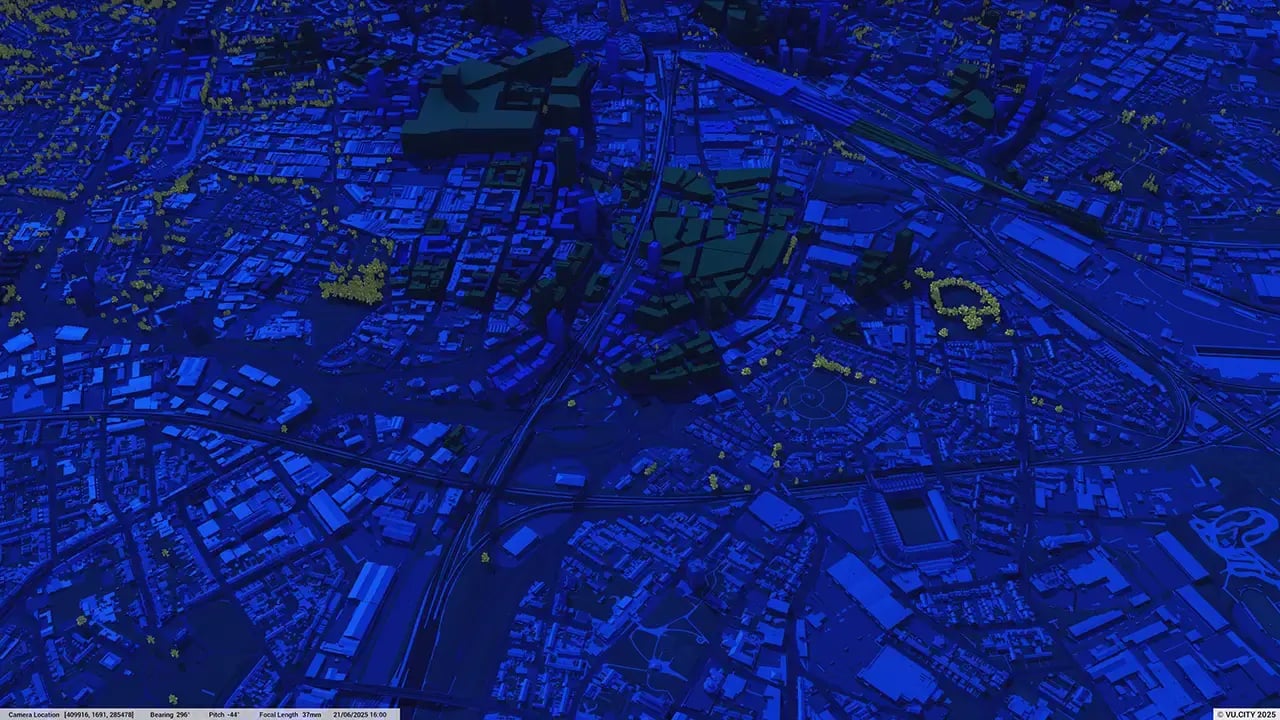
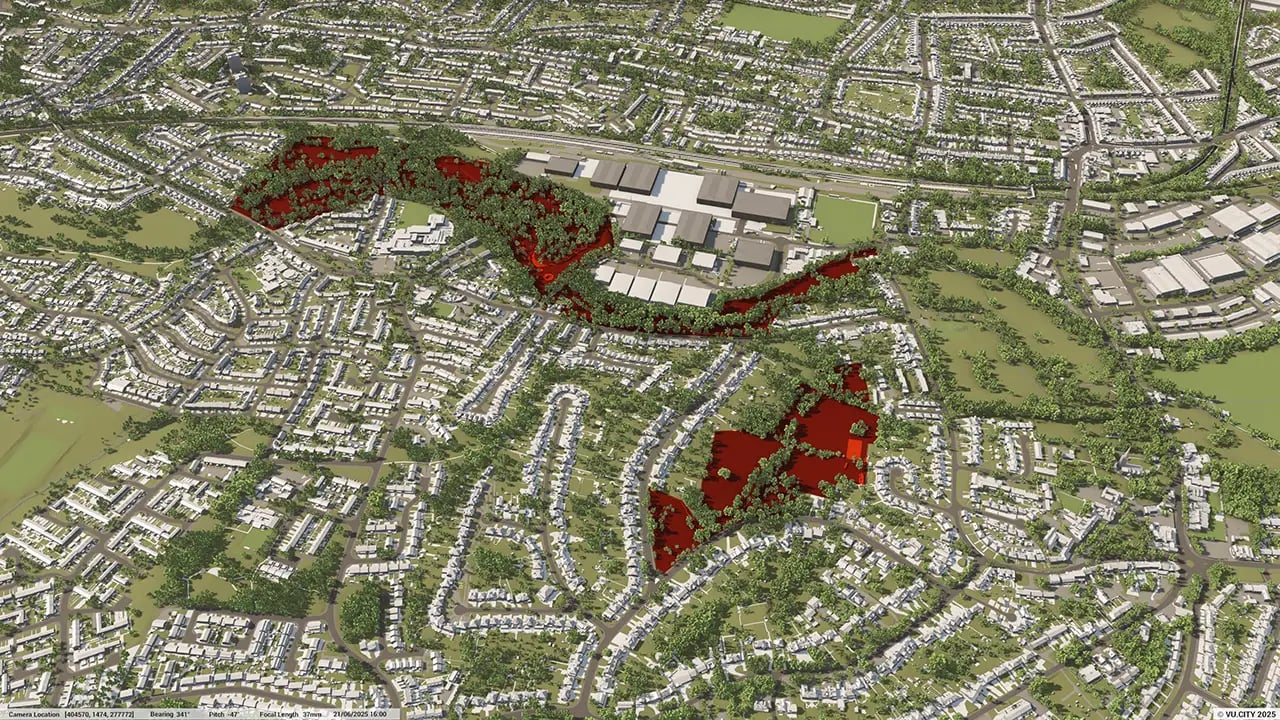
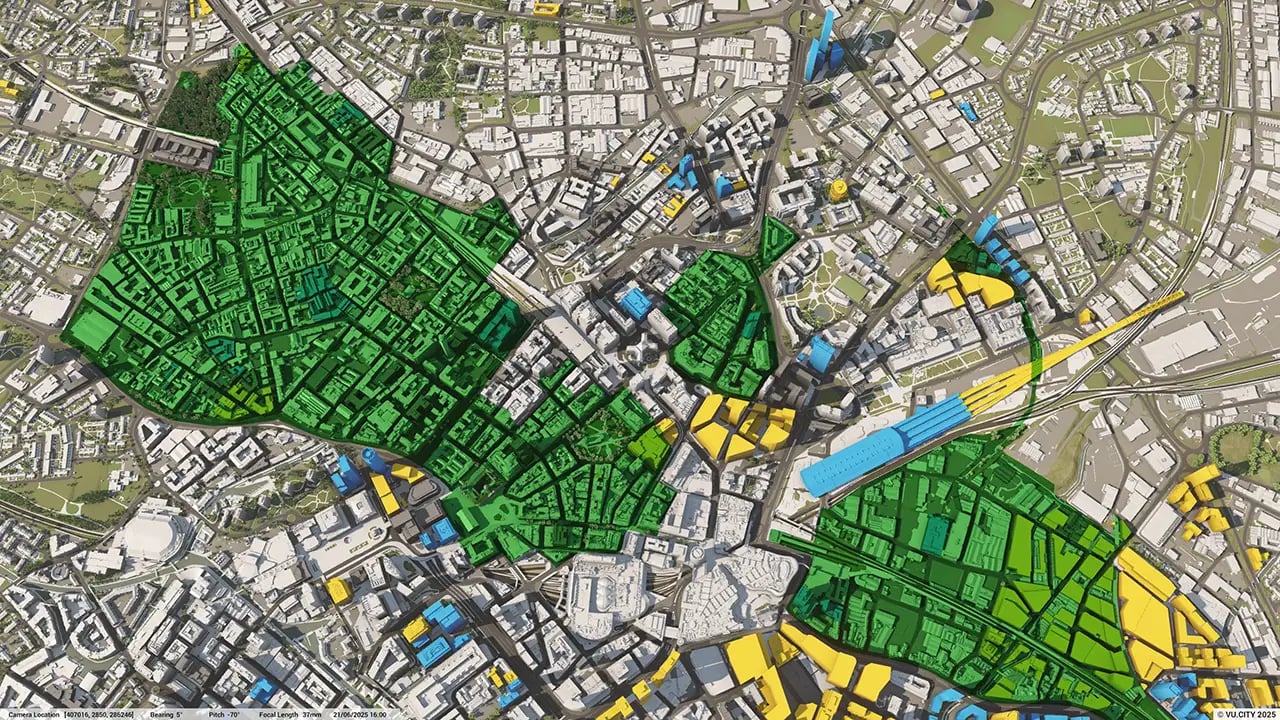
Birmingham data layers
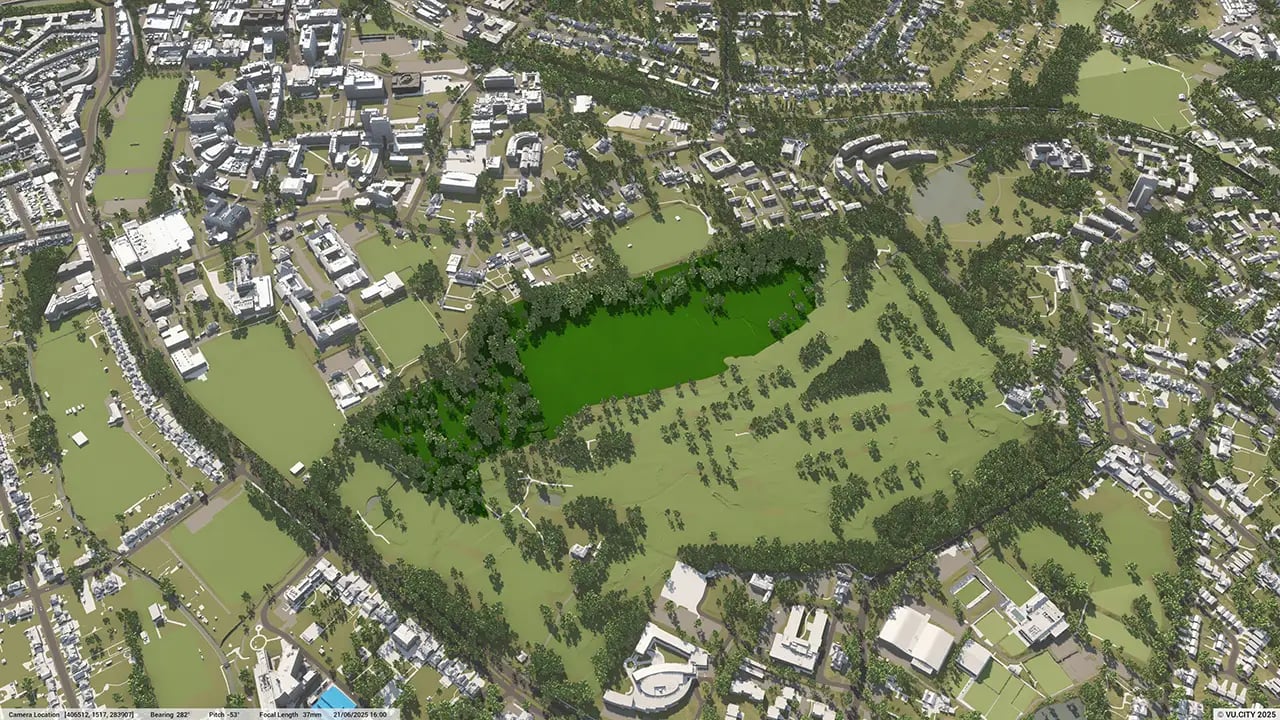
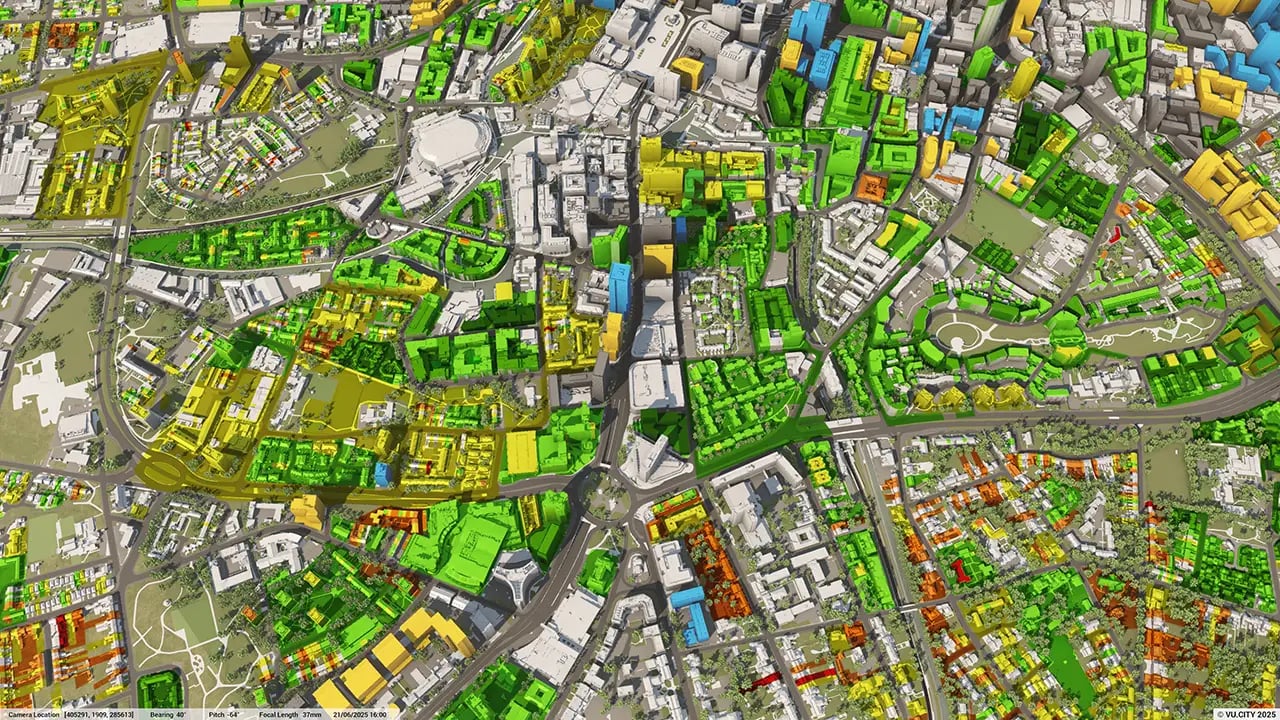
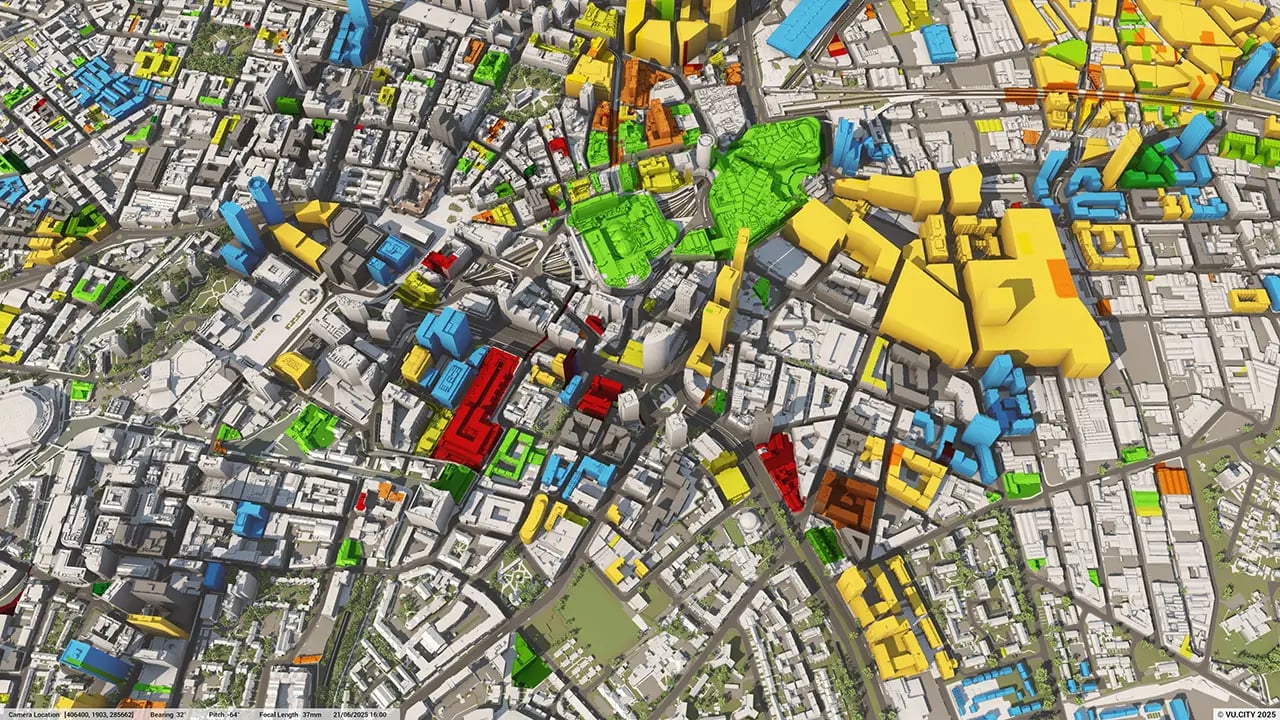
From transportation and zoning to environmental factors, VU.CITY Birmingham 3D model data layers provide essential insights for more informed and confident decision-making.
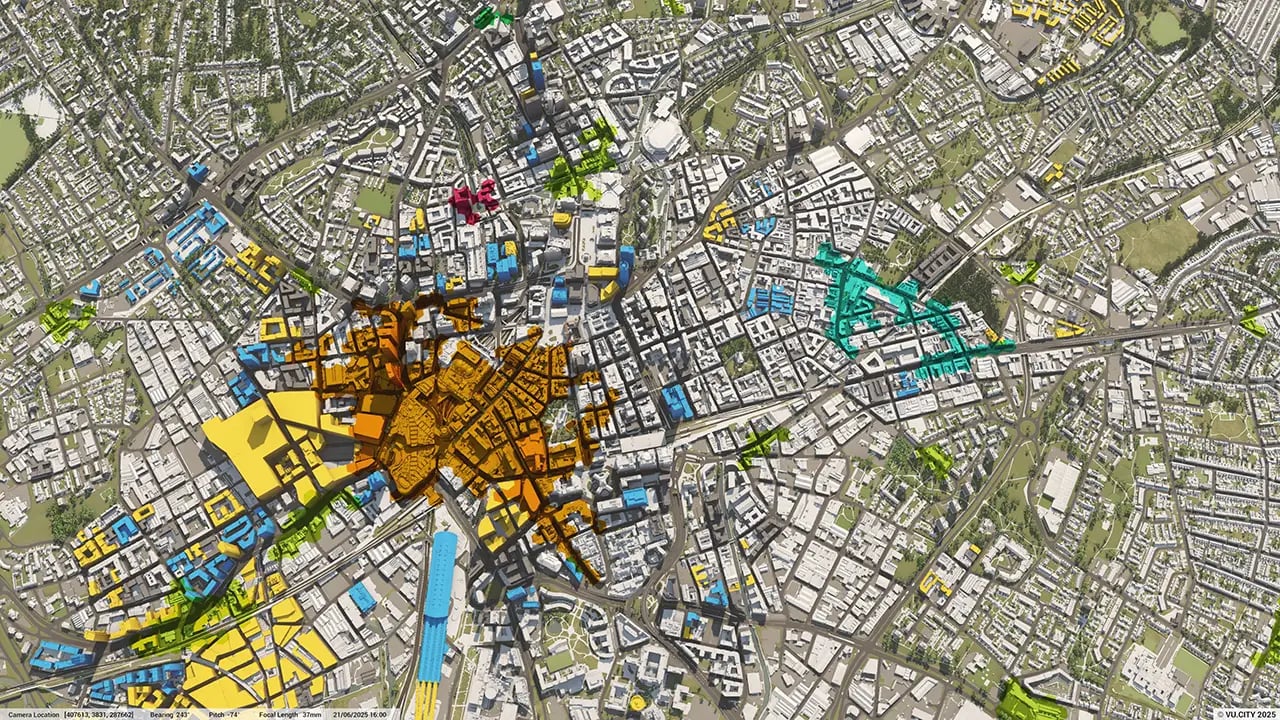

With its population set to reach 1,240,000 by 2030, Birmingham is also England’s fastest growing city. Housing and commercial and transport development needs are rapidly increasing: with much of the city and surrounding urban areas underdeveloped, Birmingham is set to be a hot spot of activity.
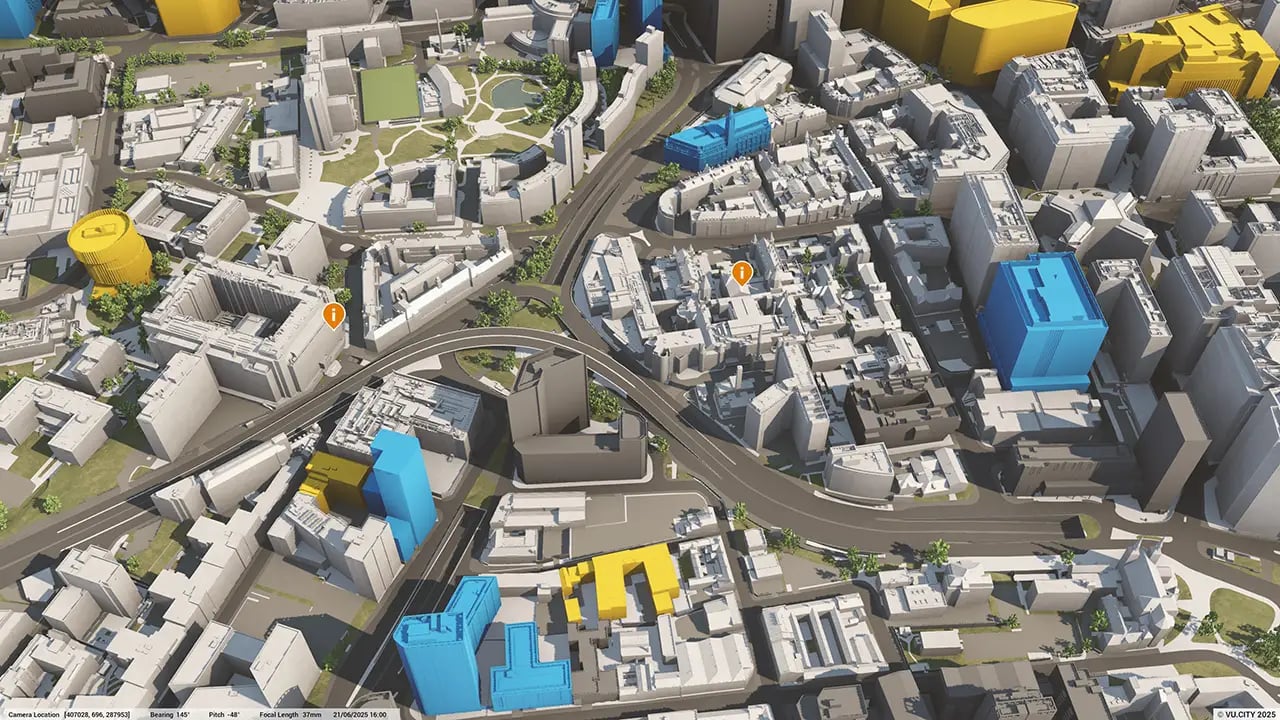
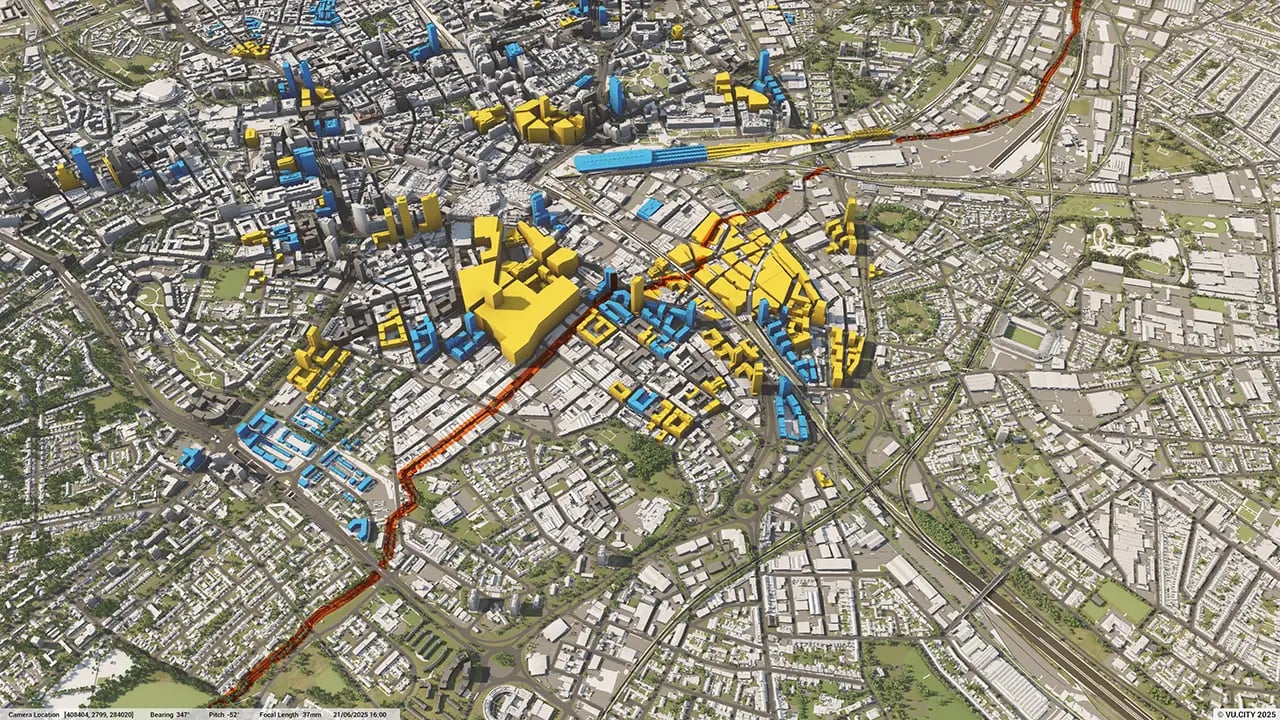
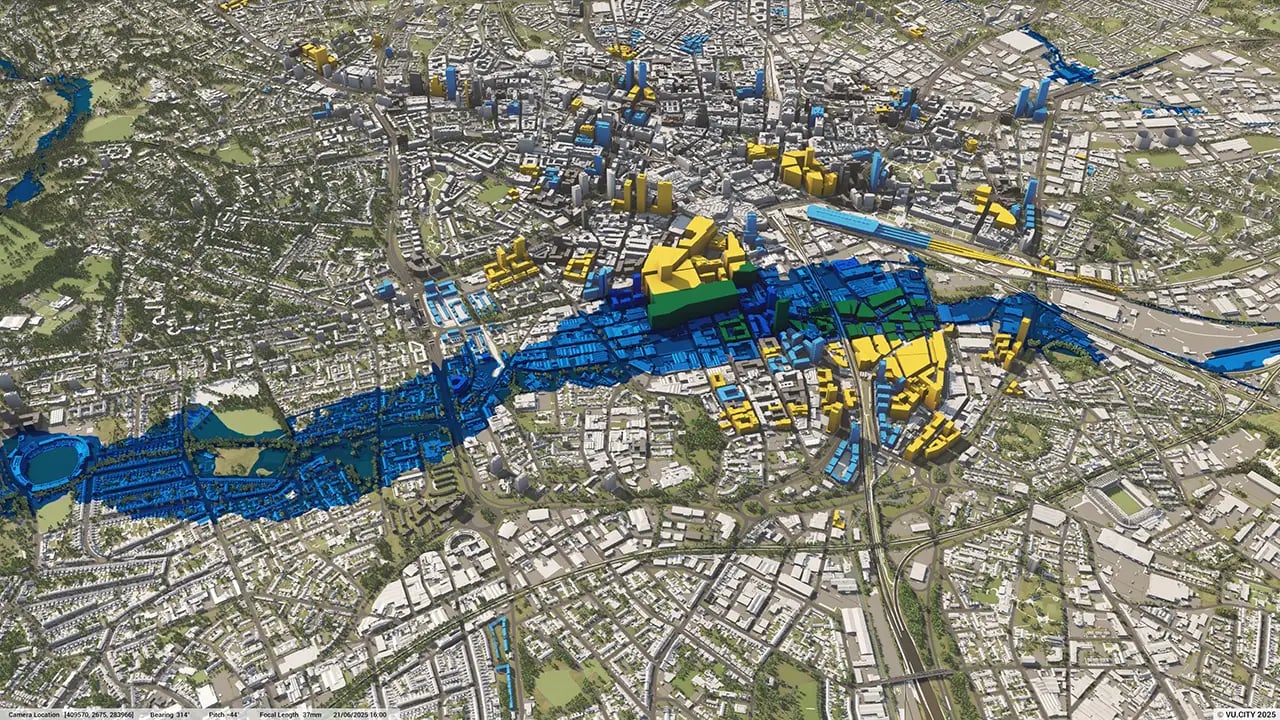
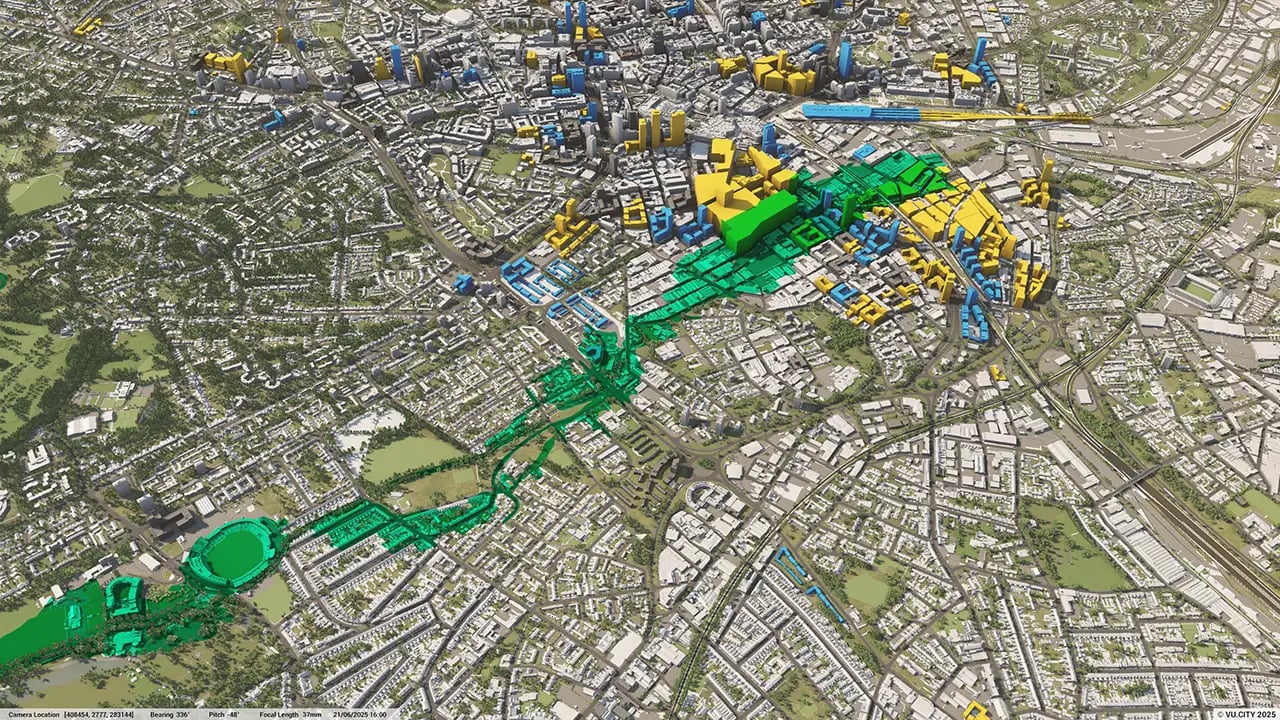
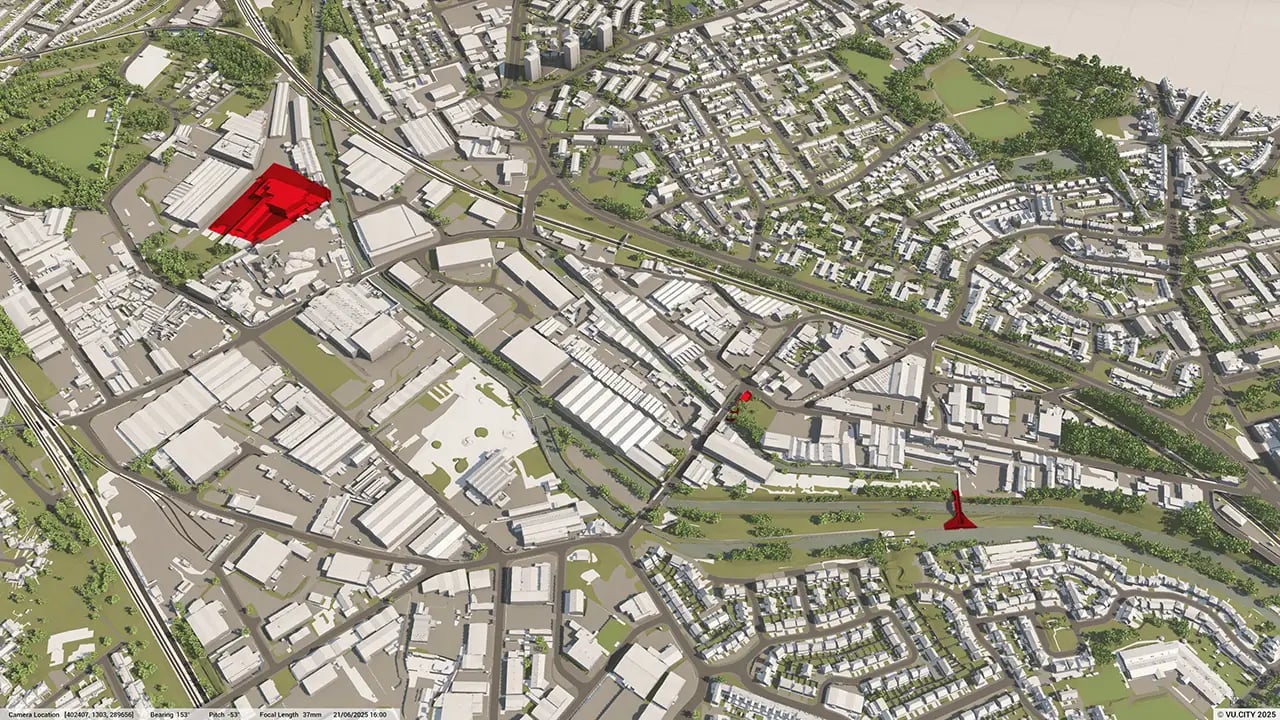
Birmingham’s flagship projects include The Curzon Street Masterplan which outlines proposals for 141 hectares of regeneration envisioned to bring 36,000 new jobs, 4,000 new homes and 600,000 square metres of commercial development. The Smithfield Market redevelopment will also create a brand new innovative and sustainable city quarter with jobs, amenities and over 3,000 much-needed new homes. This 17-hectare development will anchor an expanded city centre, helping to accelerate a wider transformation of Birmingham and supporting long-term economic and social prosperity.
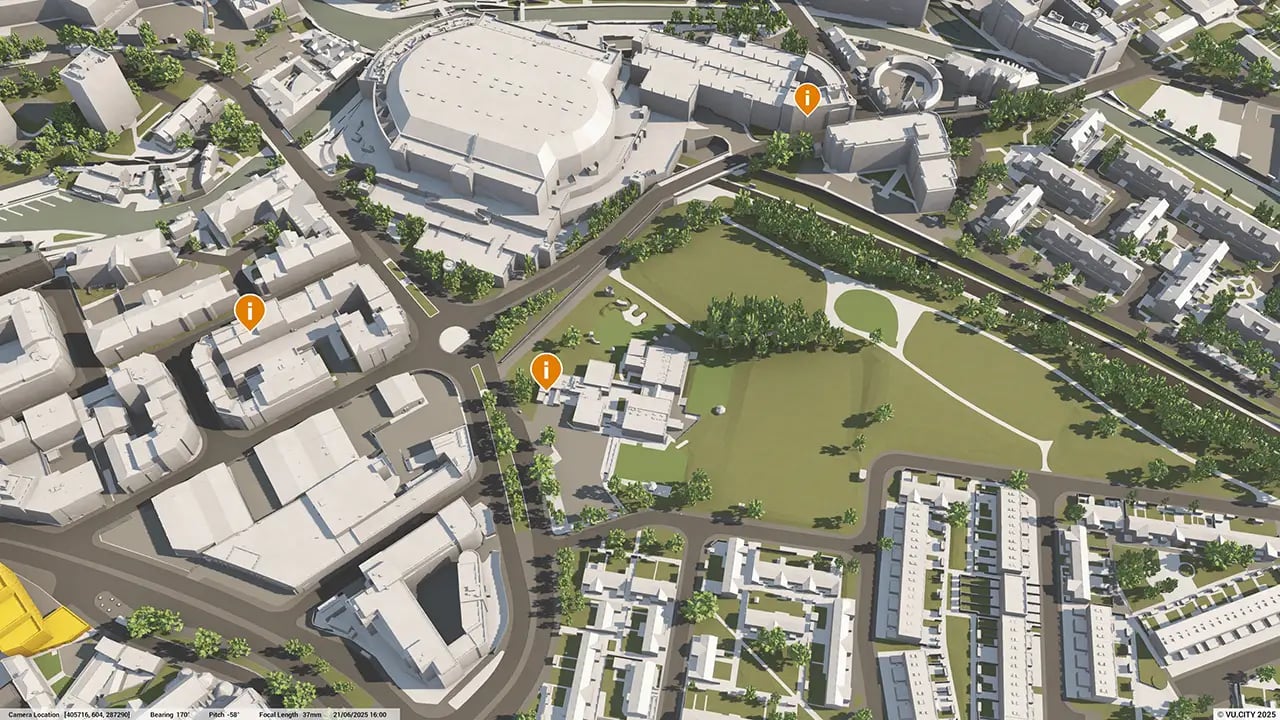
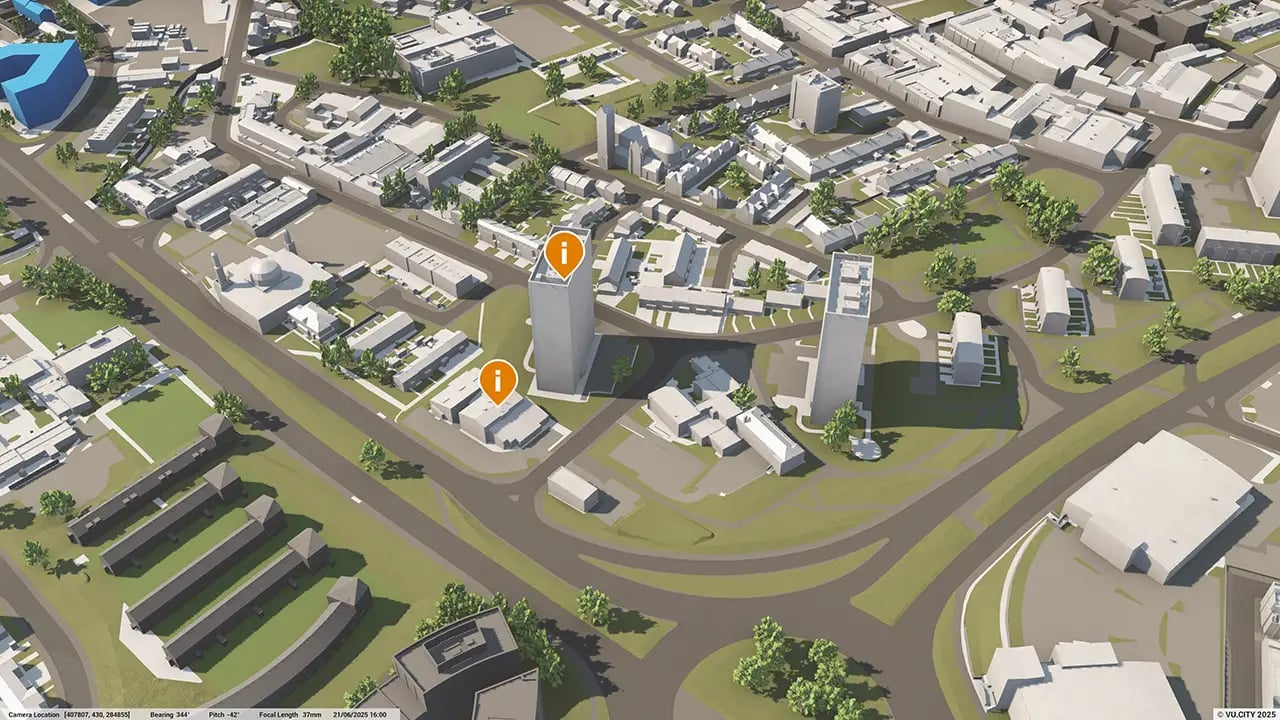
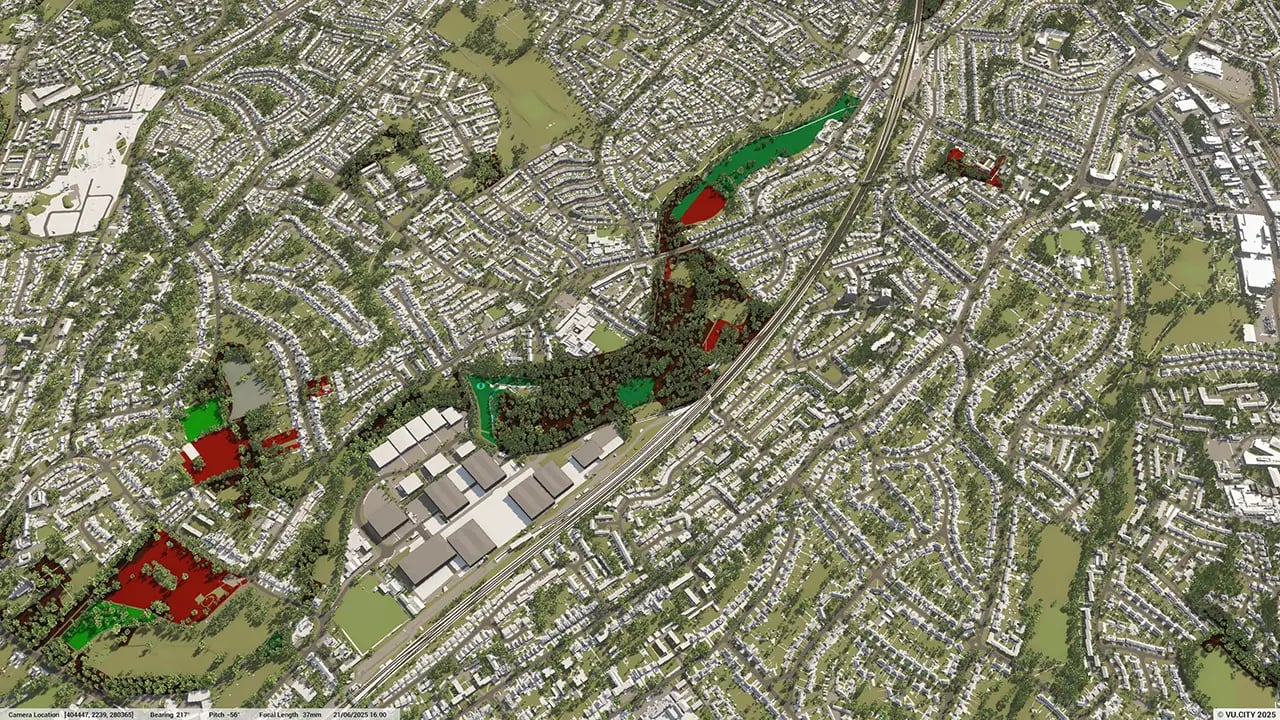
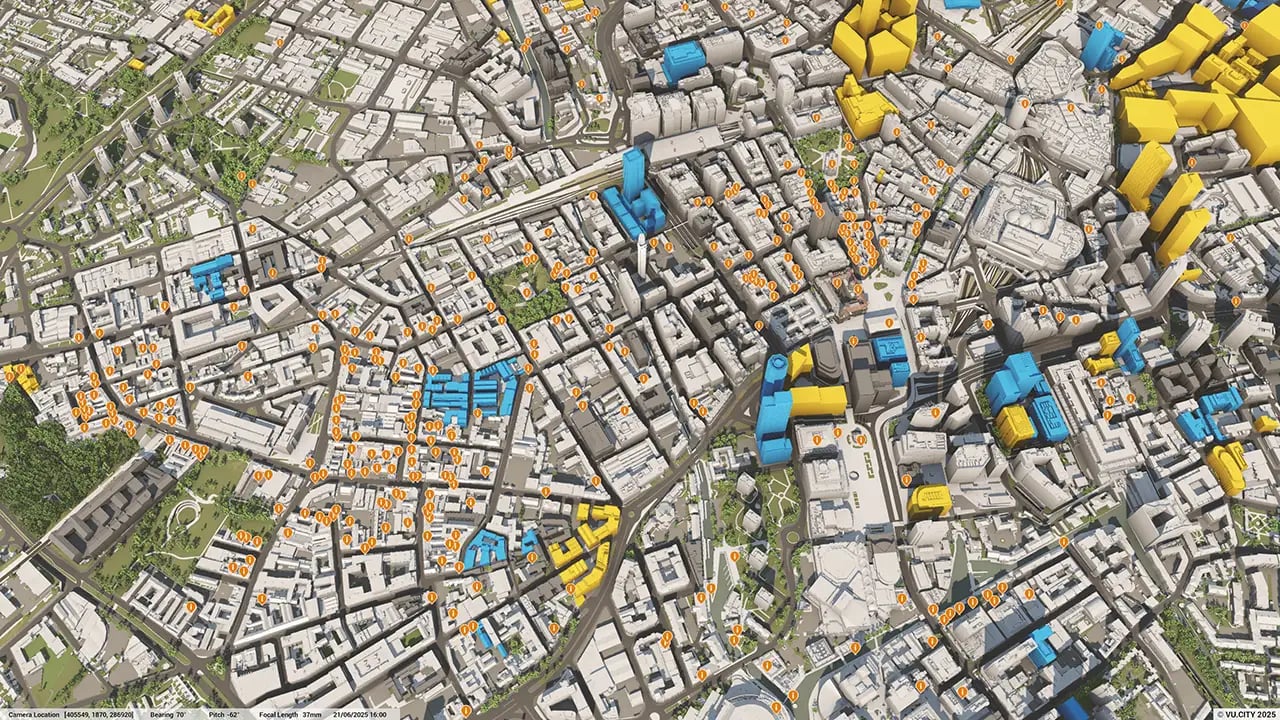
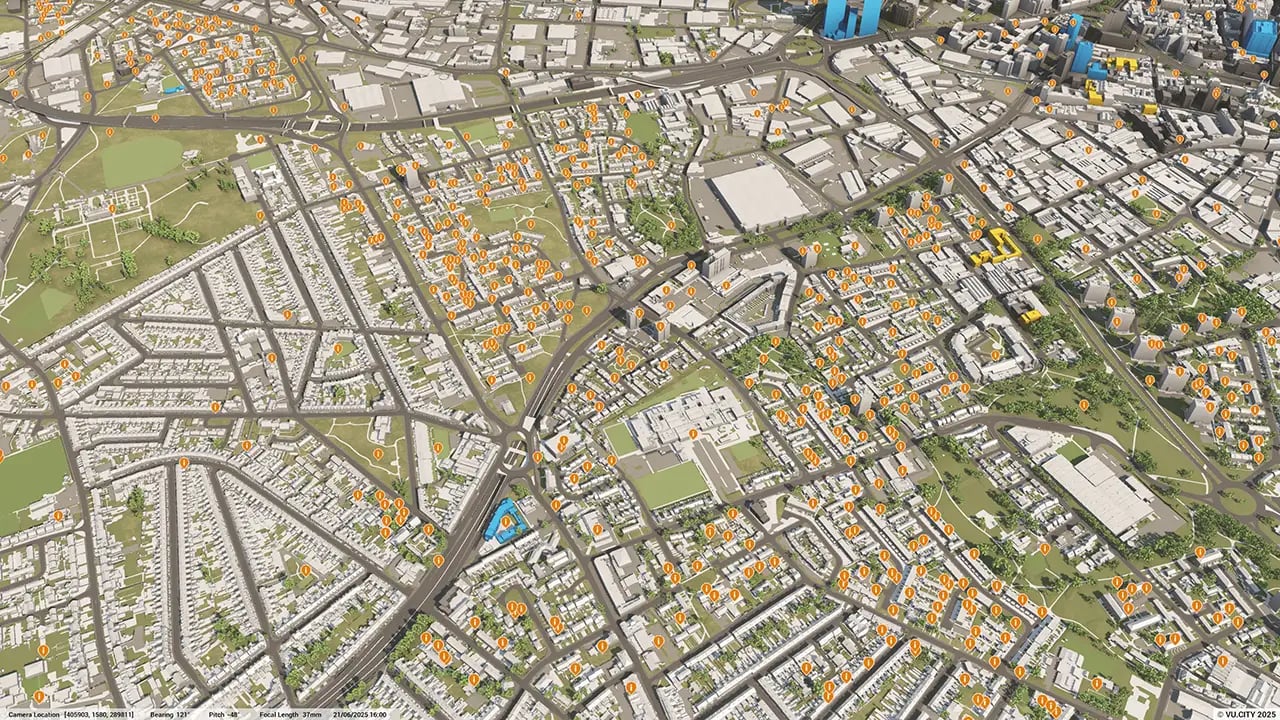
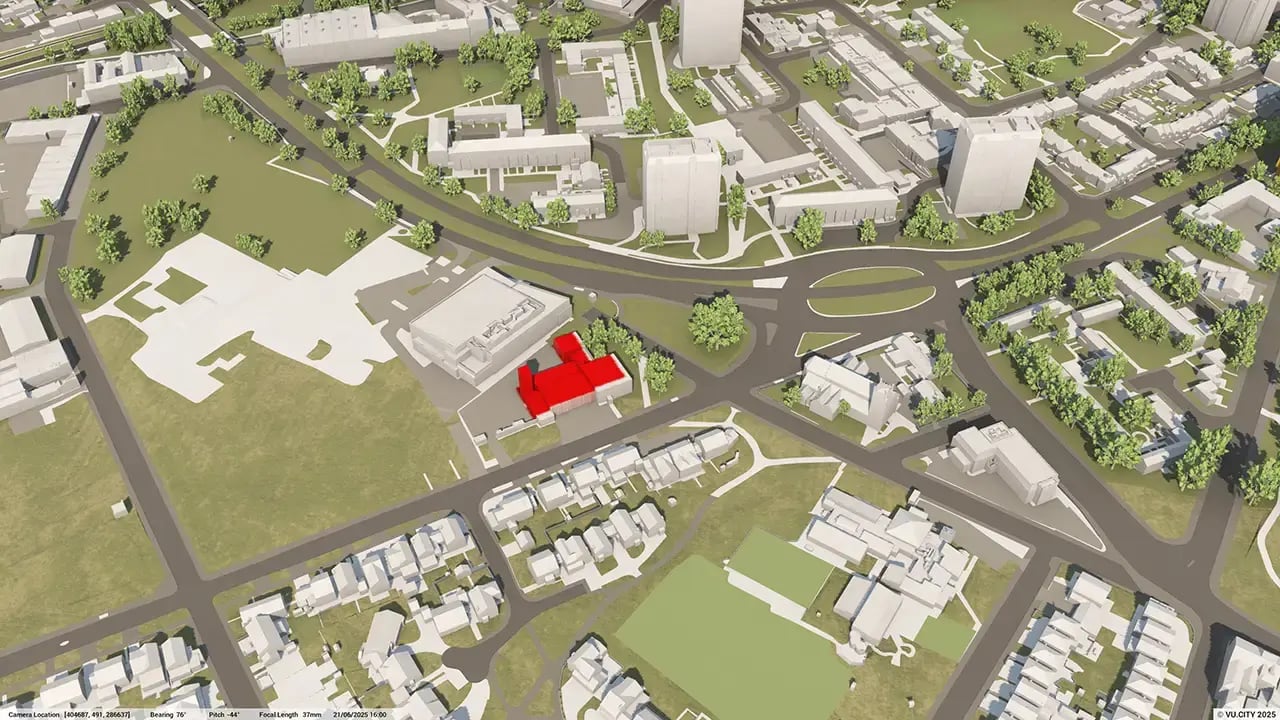
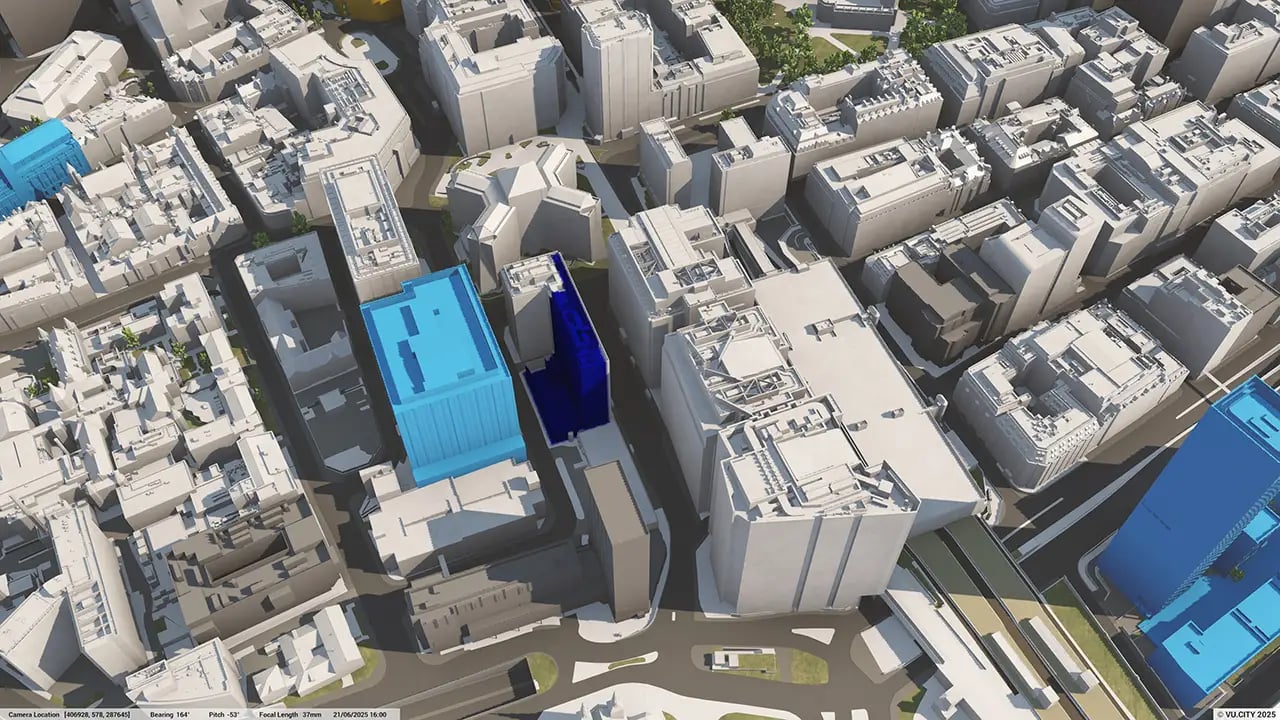
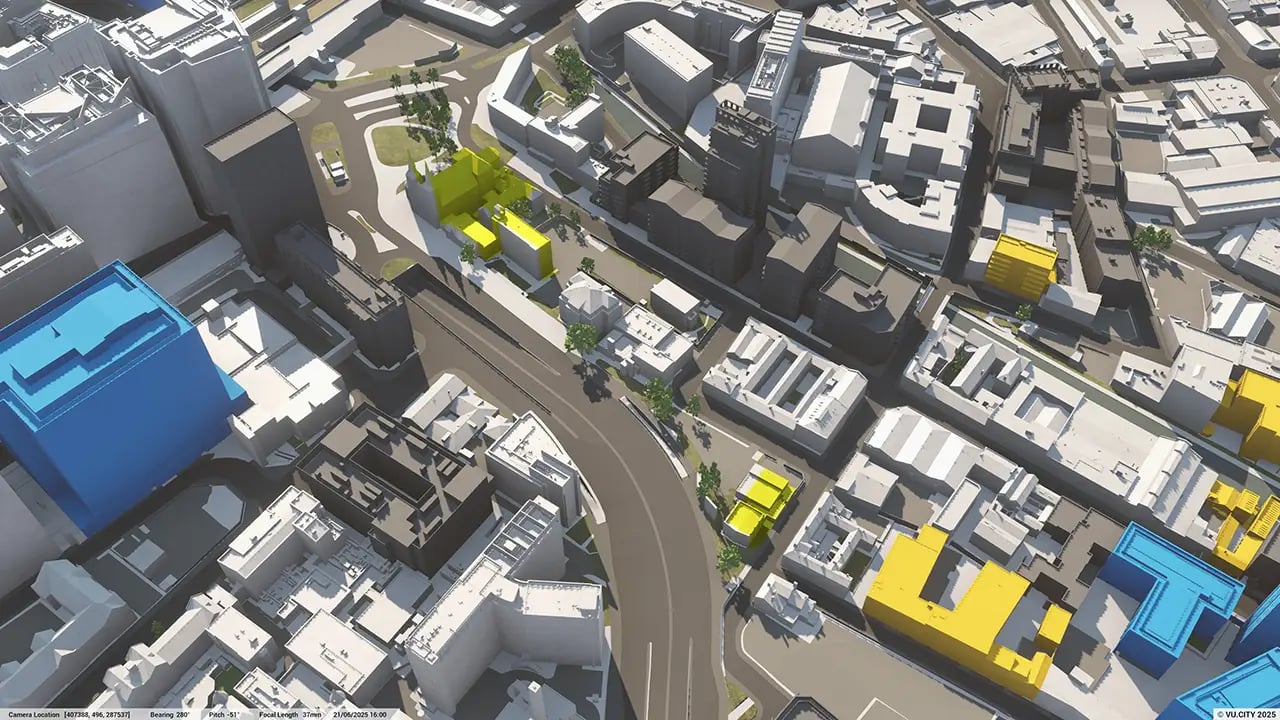
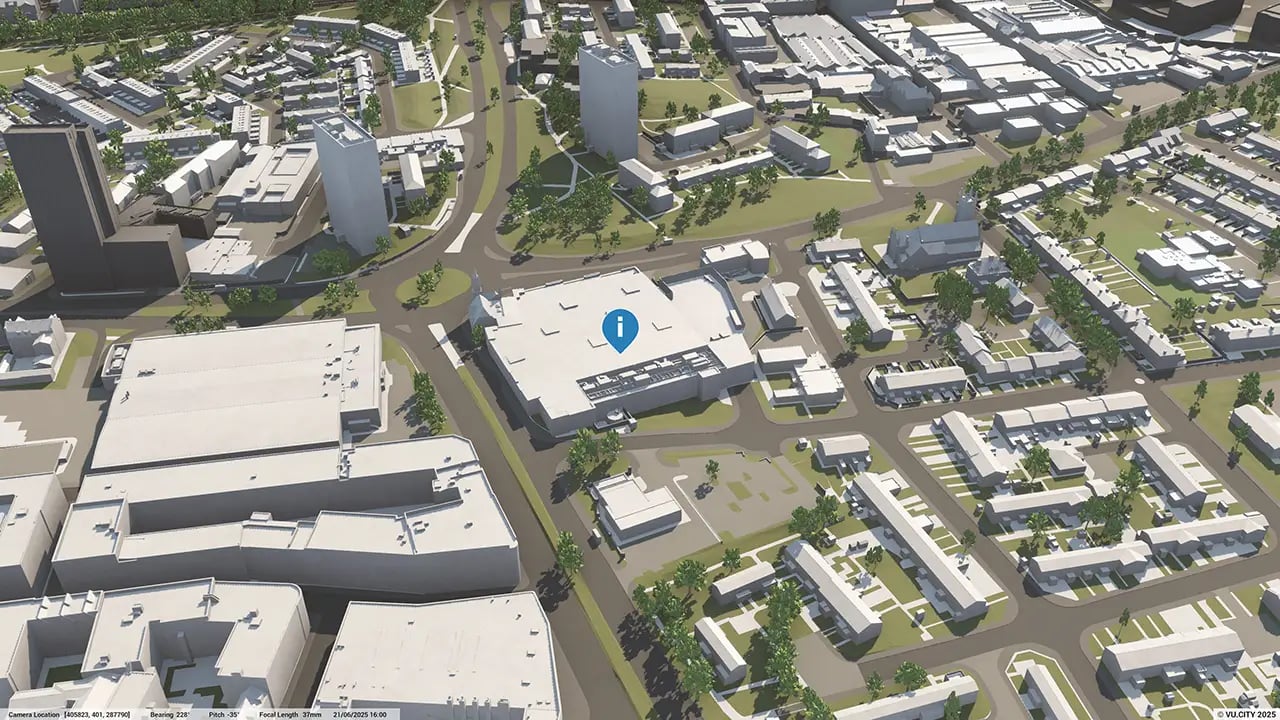
As Birmingham rapidly expands due to new developments like these and much-needed regeneration, the requirement for an open and transparent platform which can visualise and tell the story of this metropolitan giant’s reshaping is key. VU.CITY Birmingham is already meeting this by enabling all parties to see schemes in context – at a macro level and city-wide, to clearly understand where opportunities lie, such as for building densely. The implications of proposals for Birmingham can be readily and easily understood thanks to the platform’s data layers revealing a wealth of information about, for instance, locally- and statutory-listed buildings, tree preservation orders, and consented schemes.
Users of VU.CITY Birmingham include ADG, Sandwell Council, JLL, Iceni, Node and CityScape Digital who have already discovered the model’s many benefits, from being able to instantly understand and assess a site’s challenges and potential, to simplifying the planning application, or improving how everyone involved can collaborate in a simple, single platform.
Trusted by 6,000+ users across 26 cities
Architects, developers, local authorities, urban planners, and more trust VU.CITY to help achieve their goals.
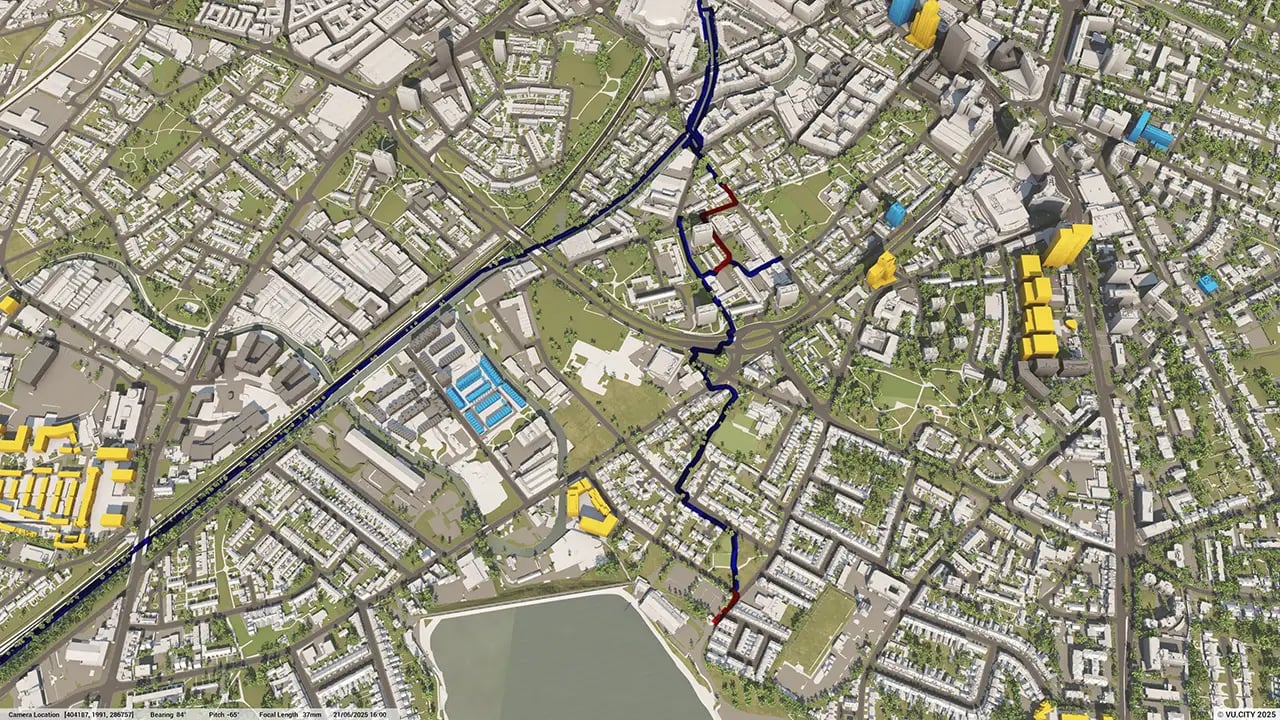
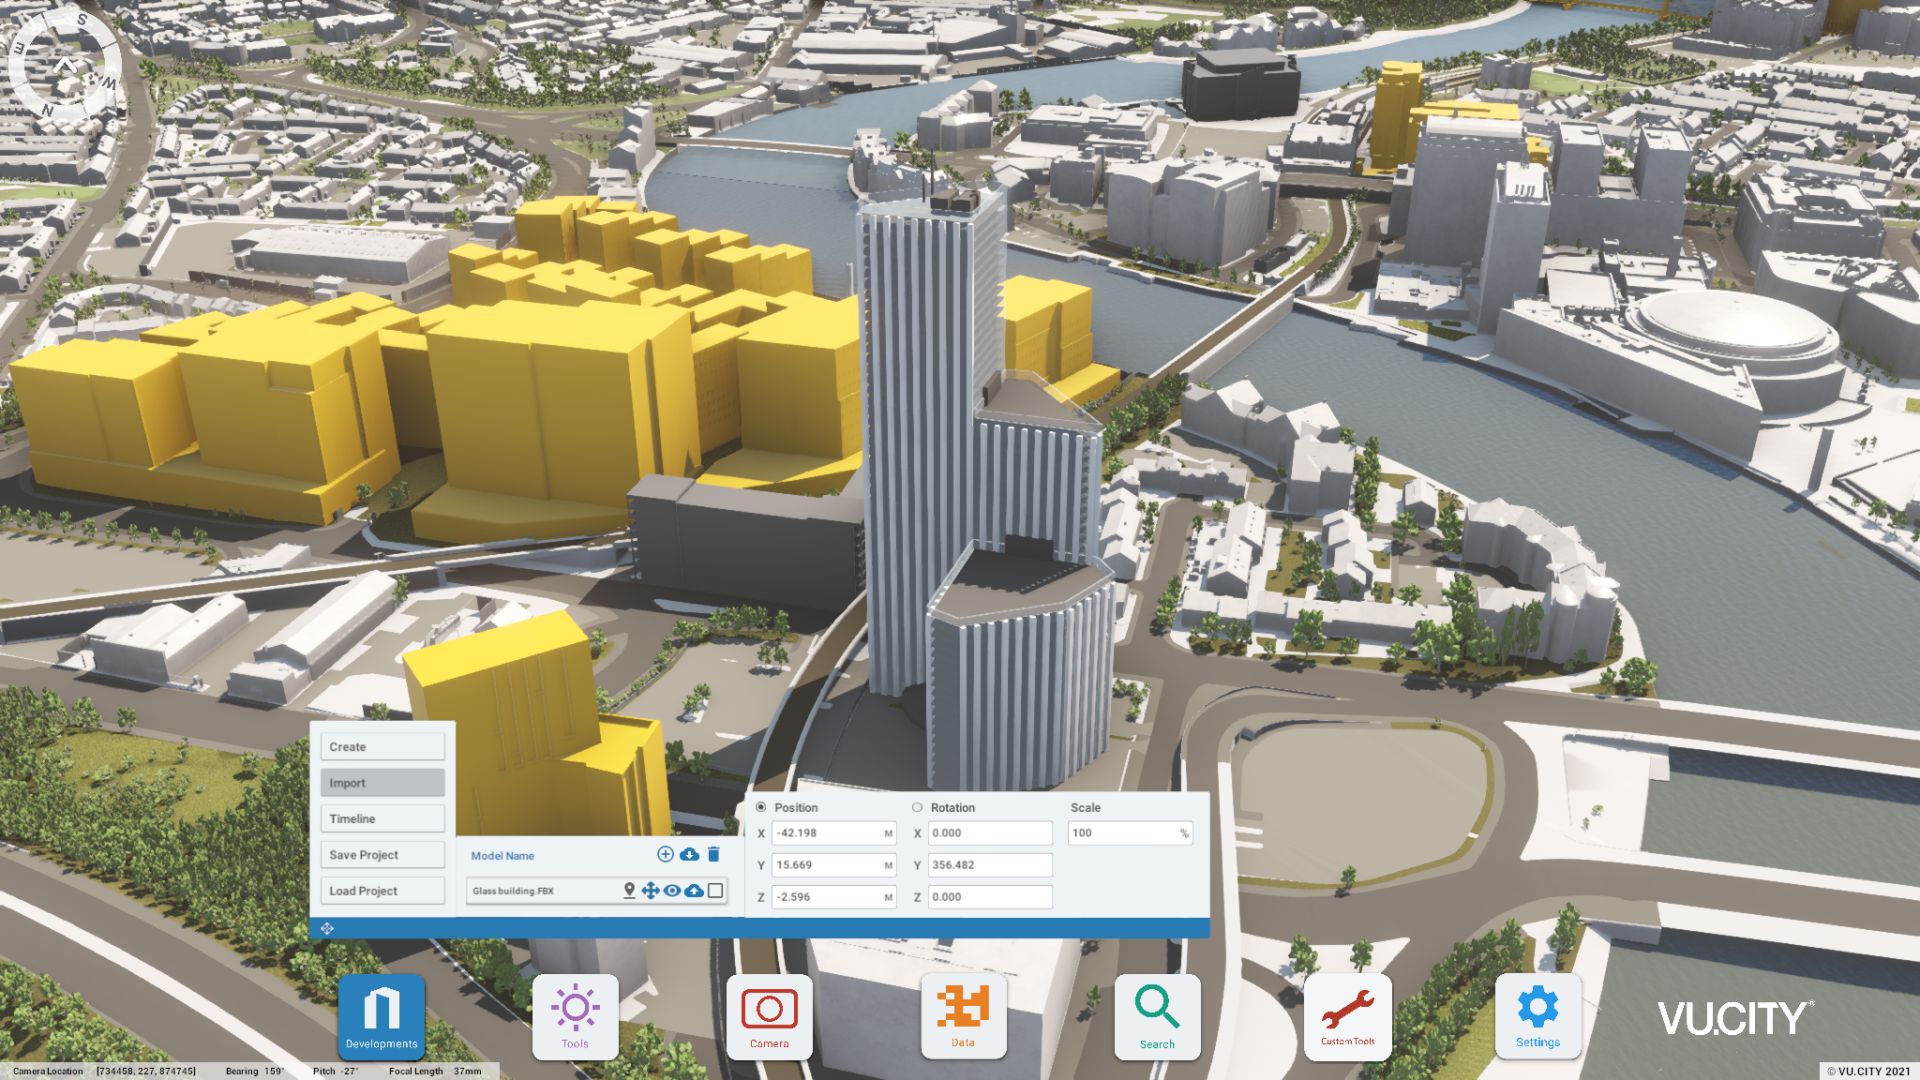
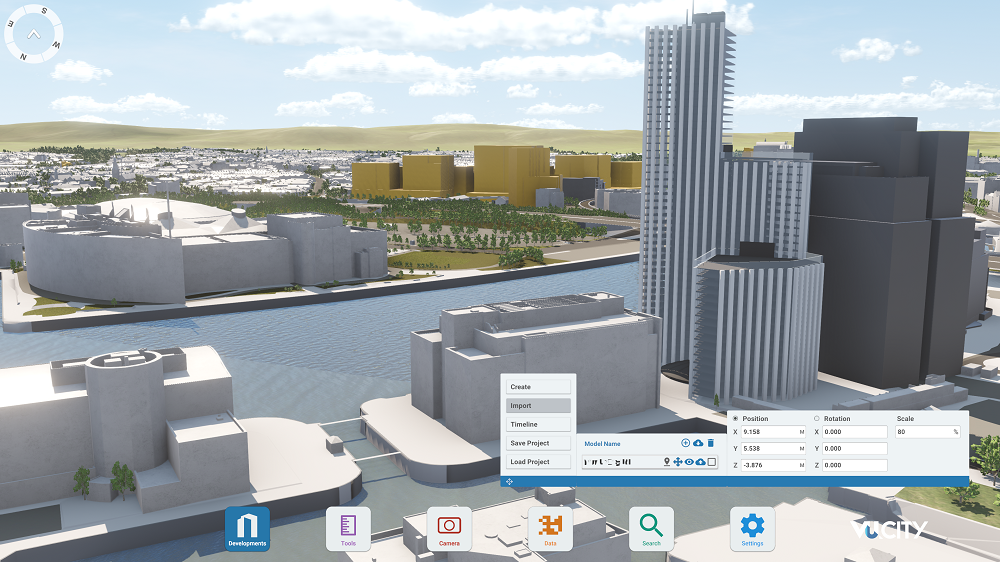
Organise and visualise your geospatial data in accurate context with our comprehensive suite of digital design and development tools.
VU.CITY Birmingham: 3D Model Features and Planning Tools
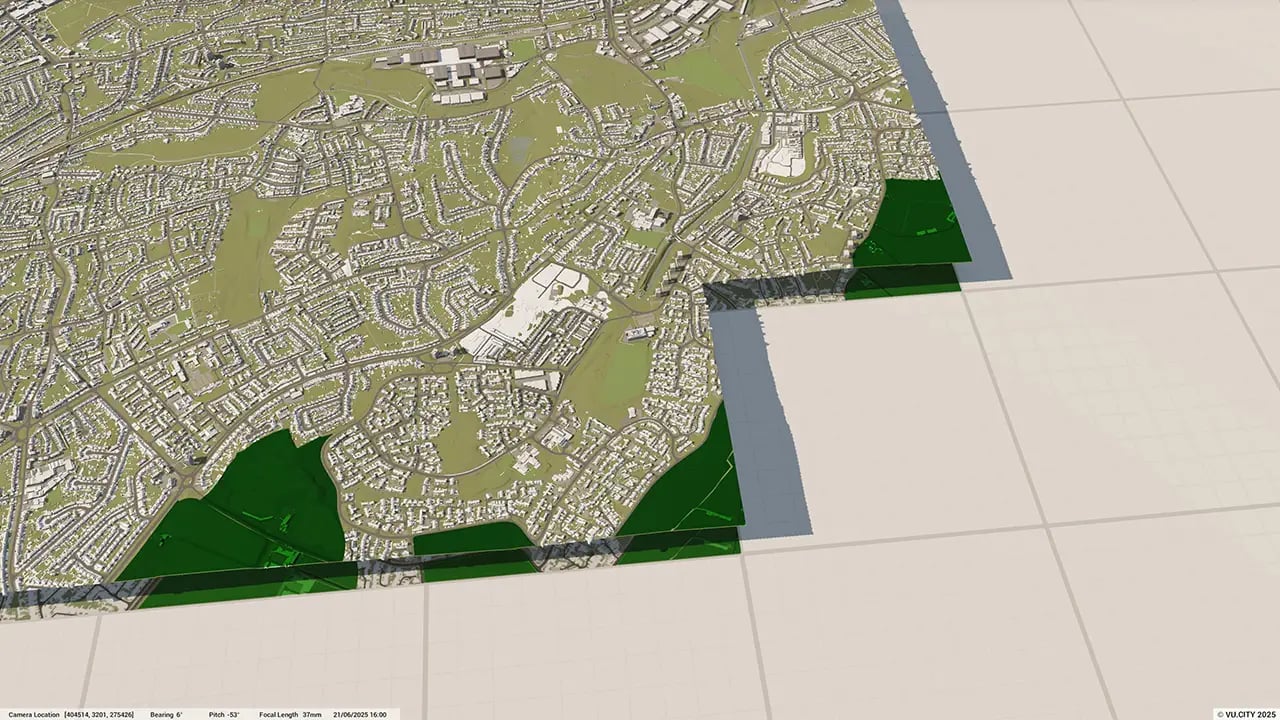
Birmingham 3D tile coverage
Whether you’re focusing on a single neighbourhood or the entire cityscape, VU.CITY provides full coverage with unmatched precision.
VU.CITY Birmingham FAQs
Here are some frequently asked questions about VU.CITY's Birmingham 3D Digital Twin and Model
How does the VU.CITY Birmingham model support large-scale development projects?
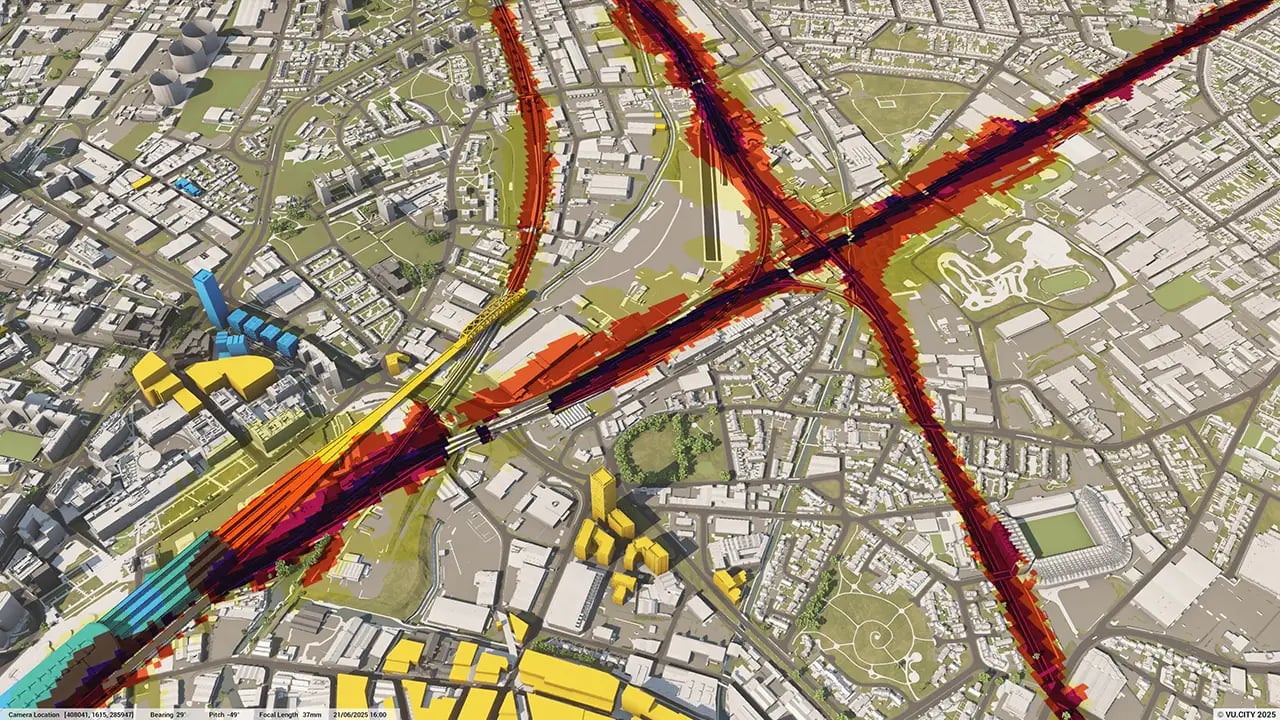
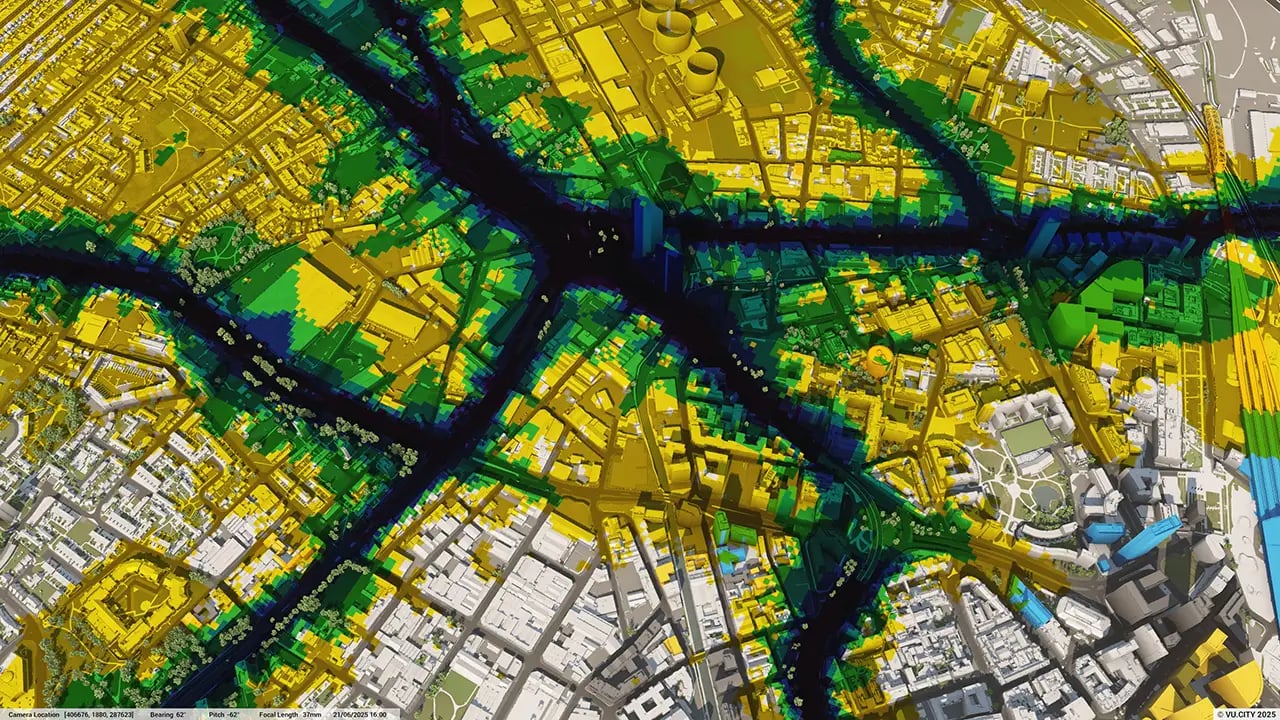
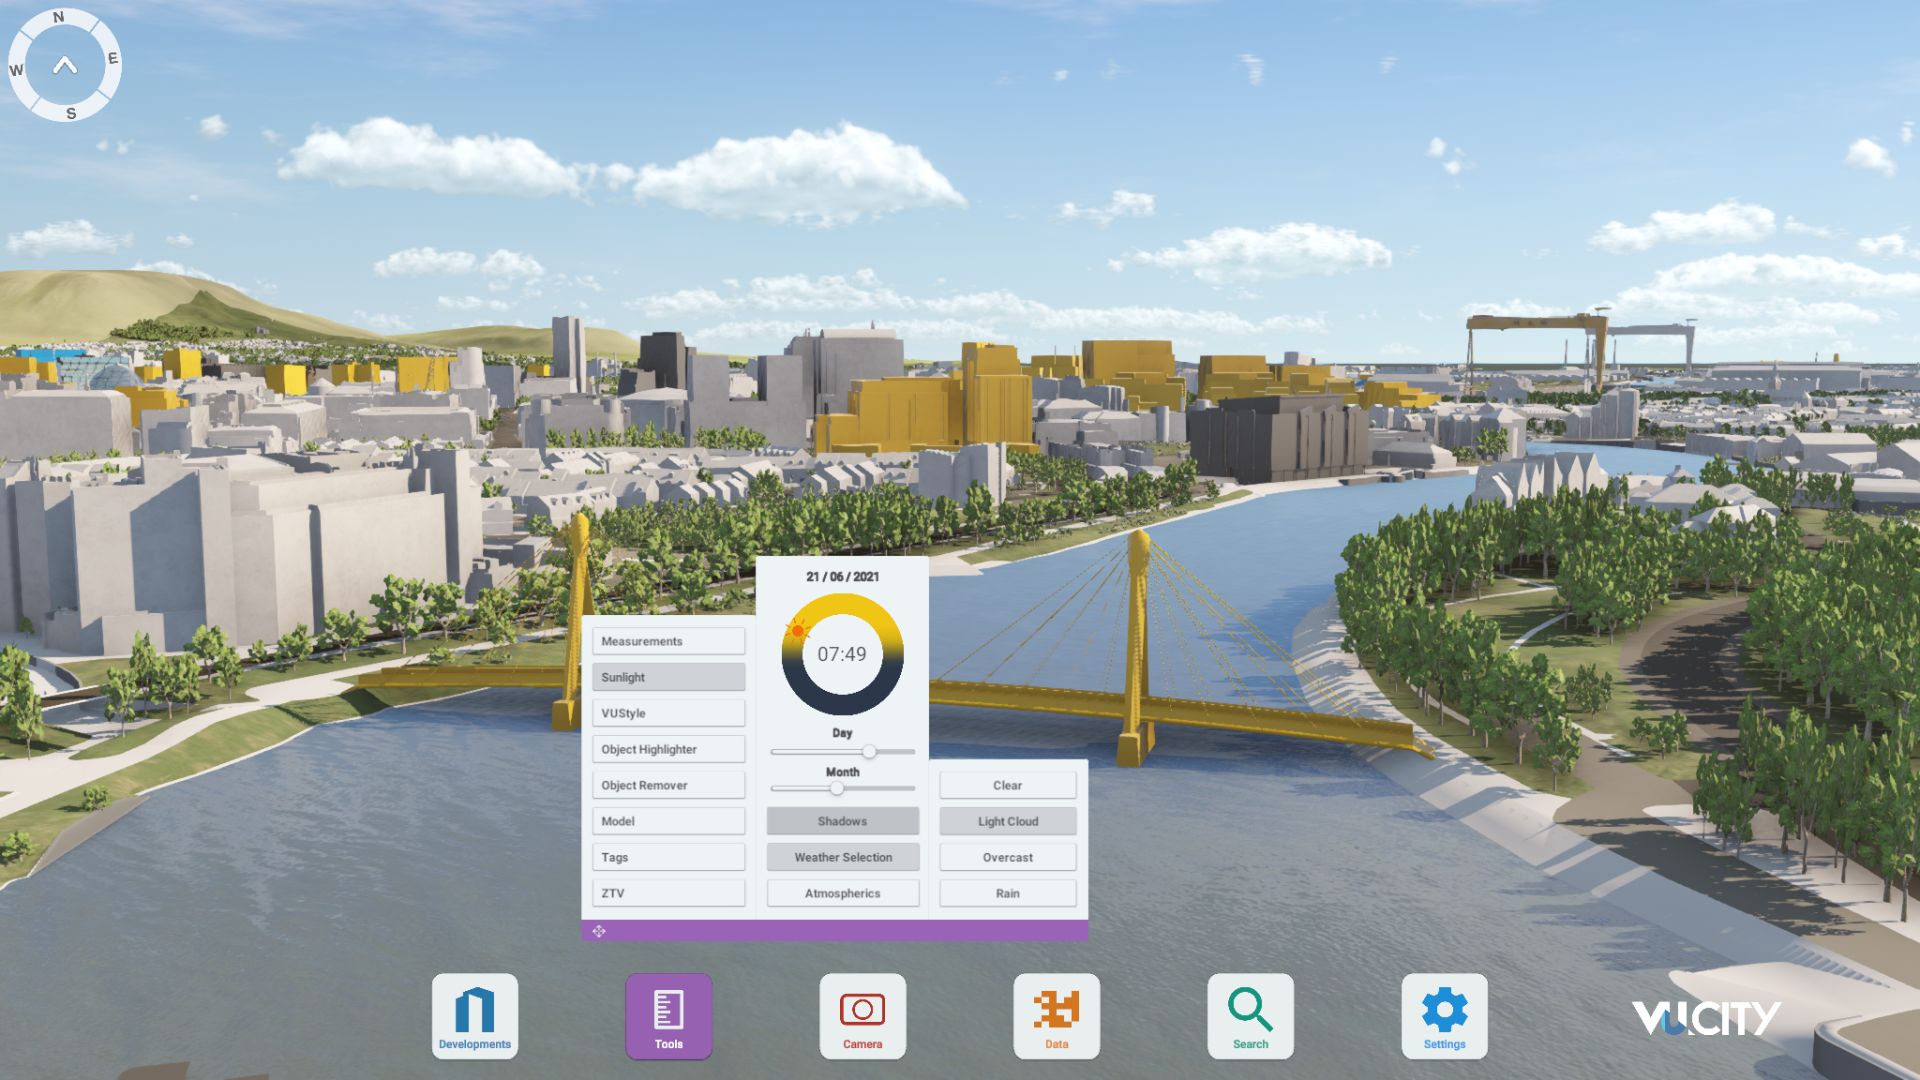
The model enables users to visualise the impact of new developments across Birmingham’s key growth areas, such as the Big City Plan and Eastside. It provides tools for assessing massing, sunlight, and view impacts, helping align projects with the city’s strategic growth goals.
Can I test different design and massing options within the Birmingham 3D model?
Yes, the model allows users to explore various massing and design scenarios early in the planning process. This helps architects and planners ensure their projects fit seamlessly into Birmingham’s urban environment and meet local planning guidelines.
How can the VU.CITY Birmingham model enhance engagement with stakeholders and the community?
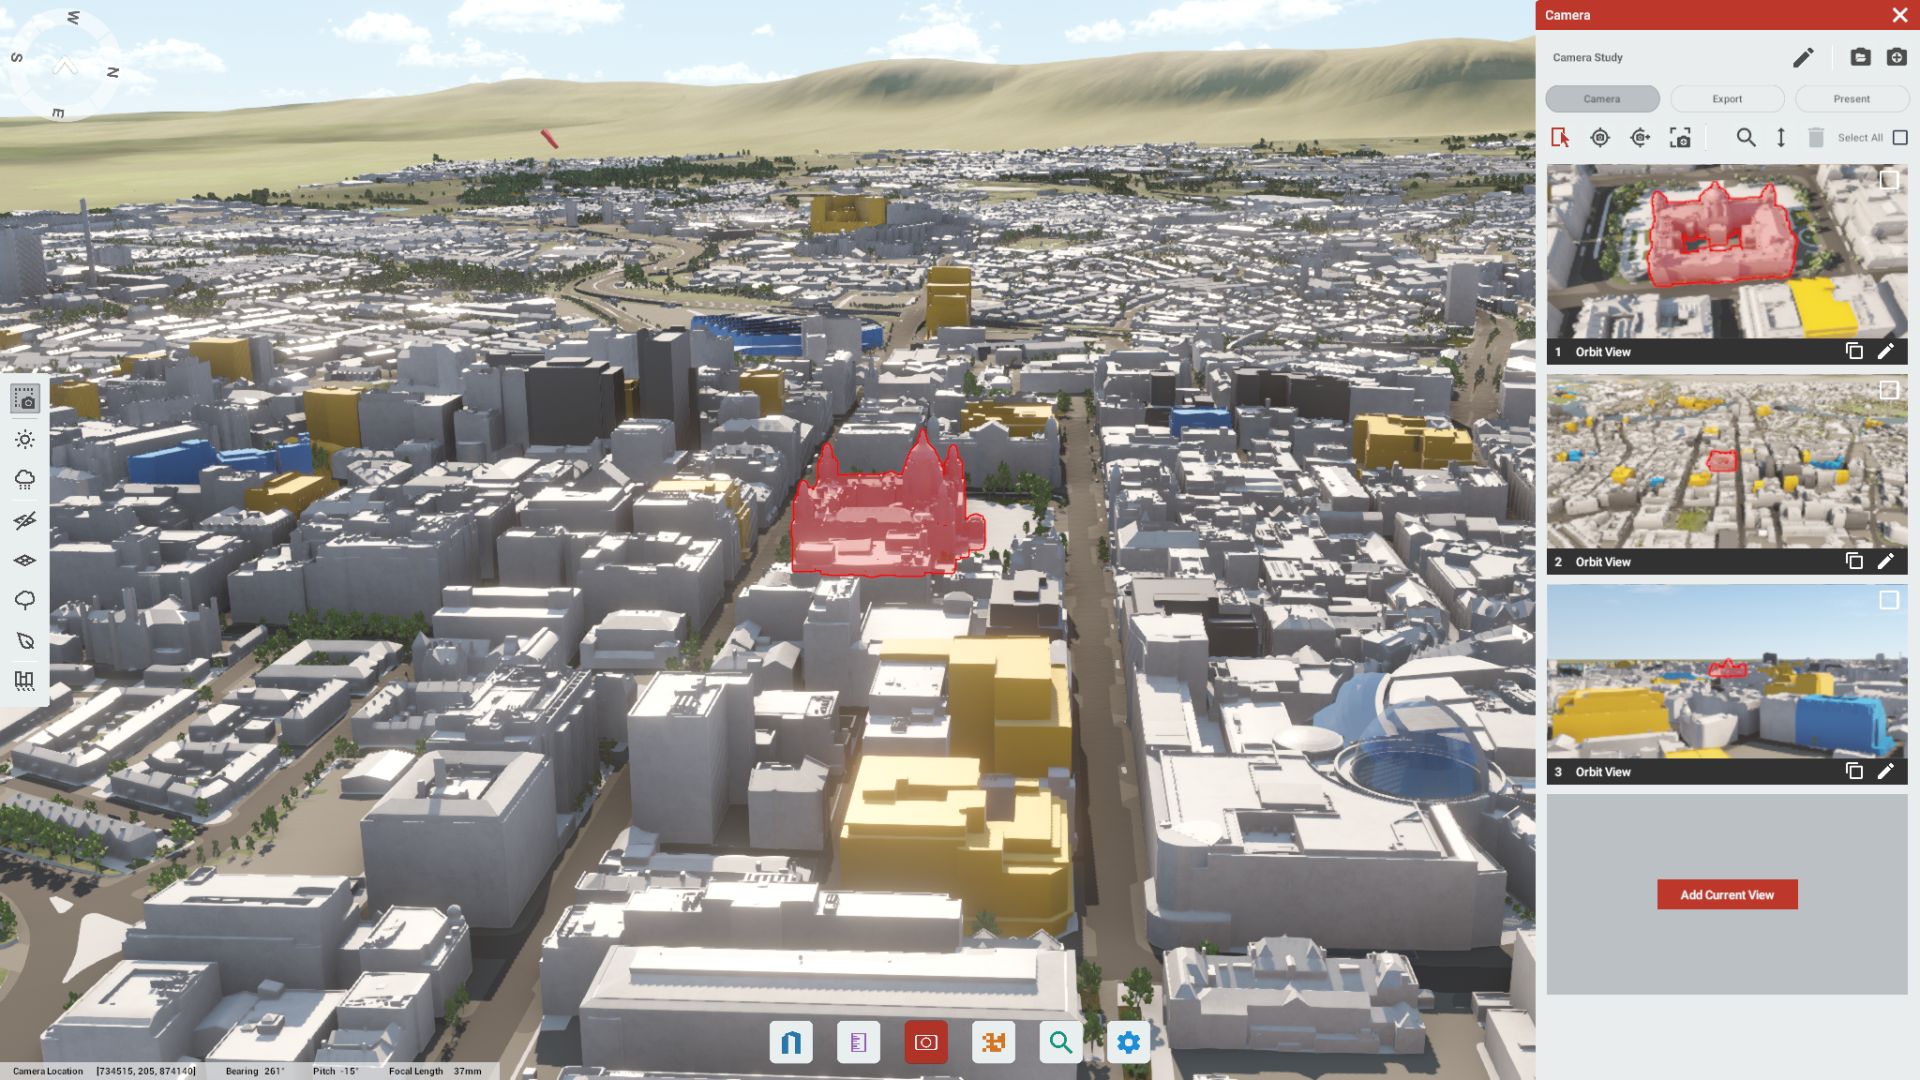
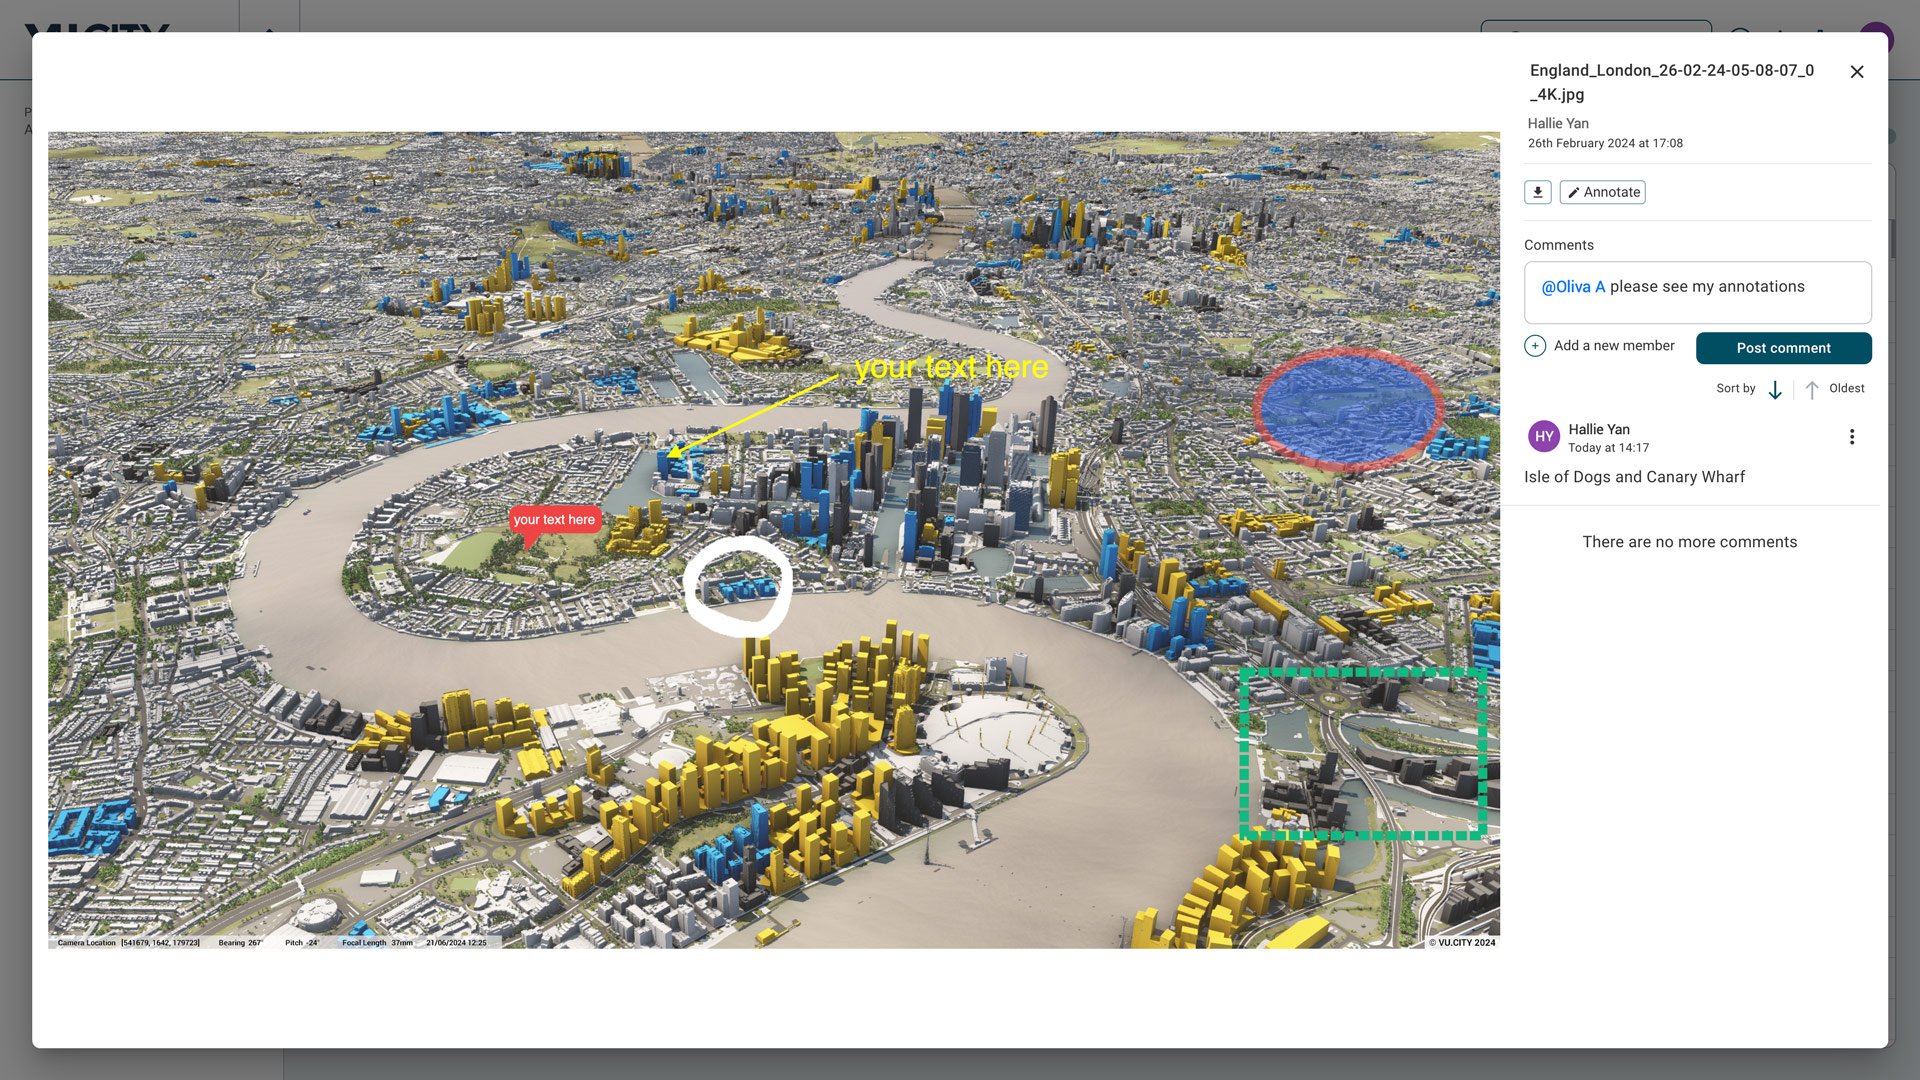
With features like the Presenter Tool and realistic camera views, users can create visual presentations to effectively communicate project impacts. This supports transparent dialogue with stakeholders and encourages community input on new developments.
What environmental and regulatory data layers are available in the Birmingham model?
The model includes data layers for sunlight and shadow analysis, flood risk zones, conservation areas, and transport links, allowing planners to make environmentally responsible decisions that align with Birmingham’s regulatory requirements.
Who benefits from using the VU.CITY Birmingham model?
Architects, planners, developers, and city officials all benefit. The model streamlines project planning, supports sustainable development, and ensures that new projects align with Birmingham’s vision for growth and regeneration while respecting its historic landscape.
Explore digital 3D geospatial solutions for the built environment
VU.CITY provides clear, powerful tools for key decision-makers across the built environment, helping them visualise and shape the future of cities with confidence and precision.
Make smarter decisions with data-driven insights, from infrastructure to sustainability.
Unlock the power of Generative AI for optimal design and streamlined decision-making.
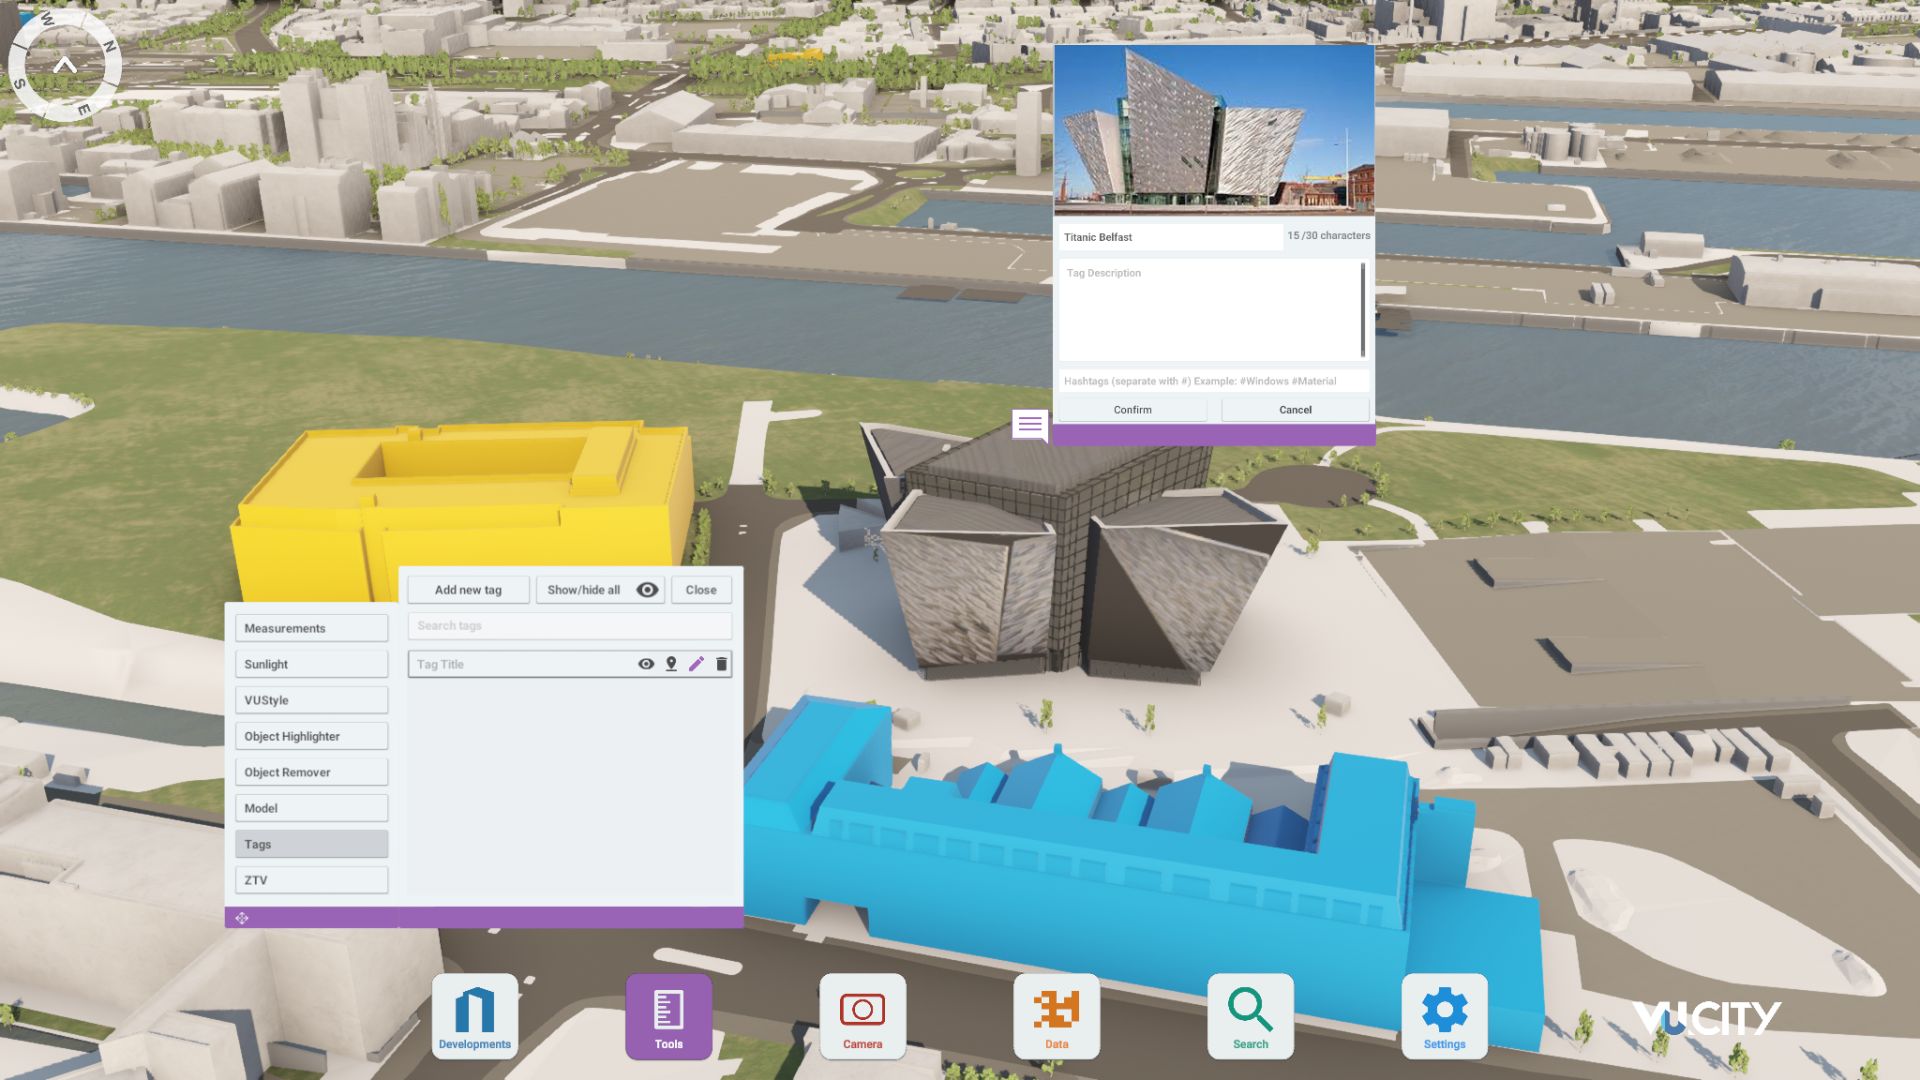
Bring your designs to 3D life with state-of-the-art modelling tools.
Collaborate seamlessly across studies, planning, and design.
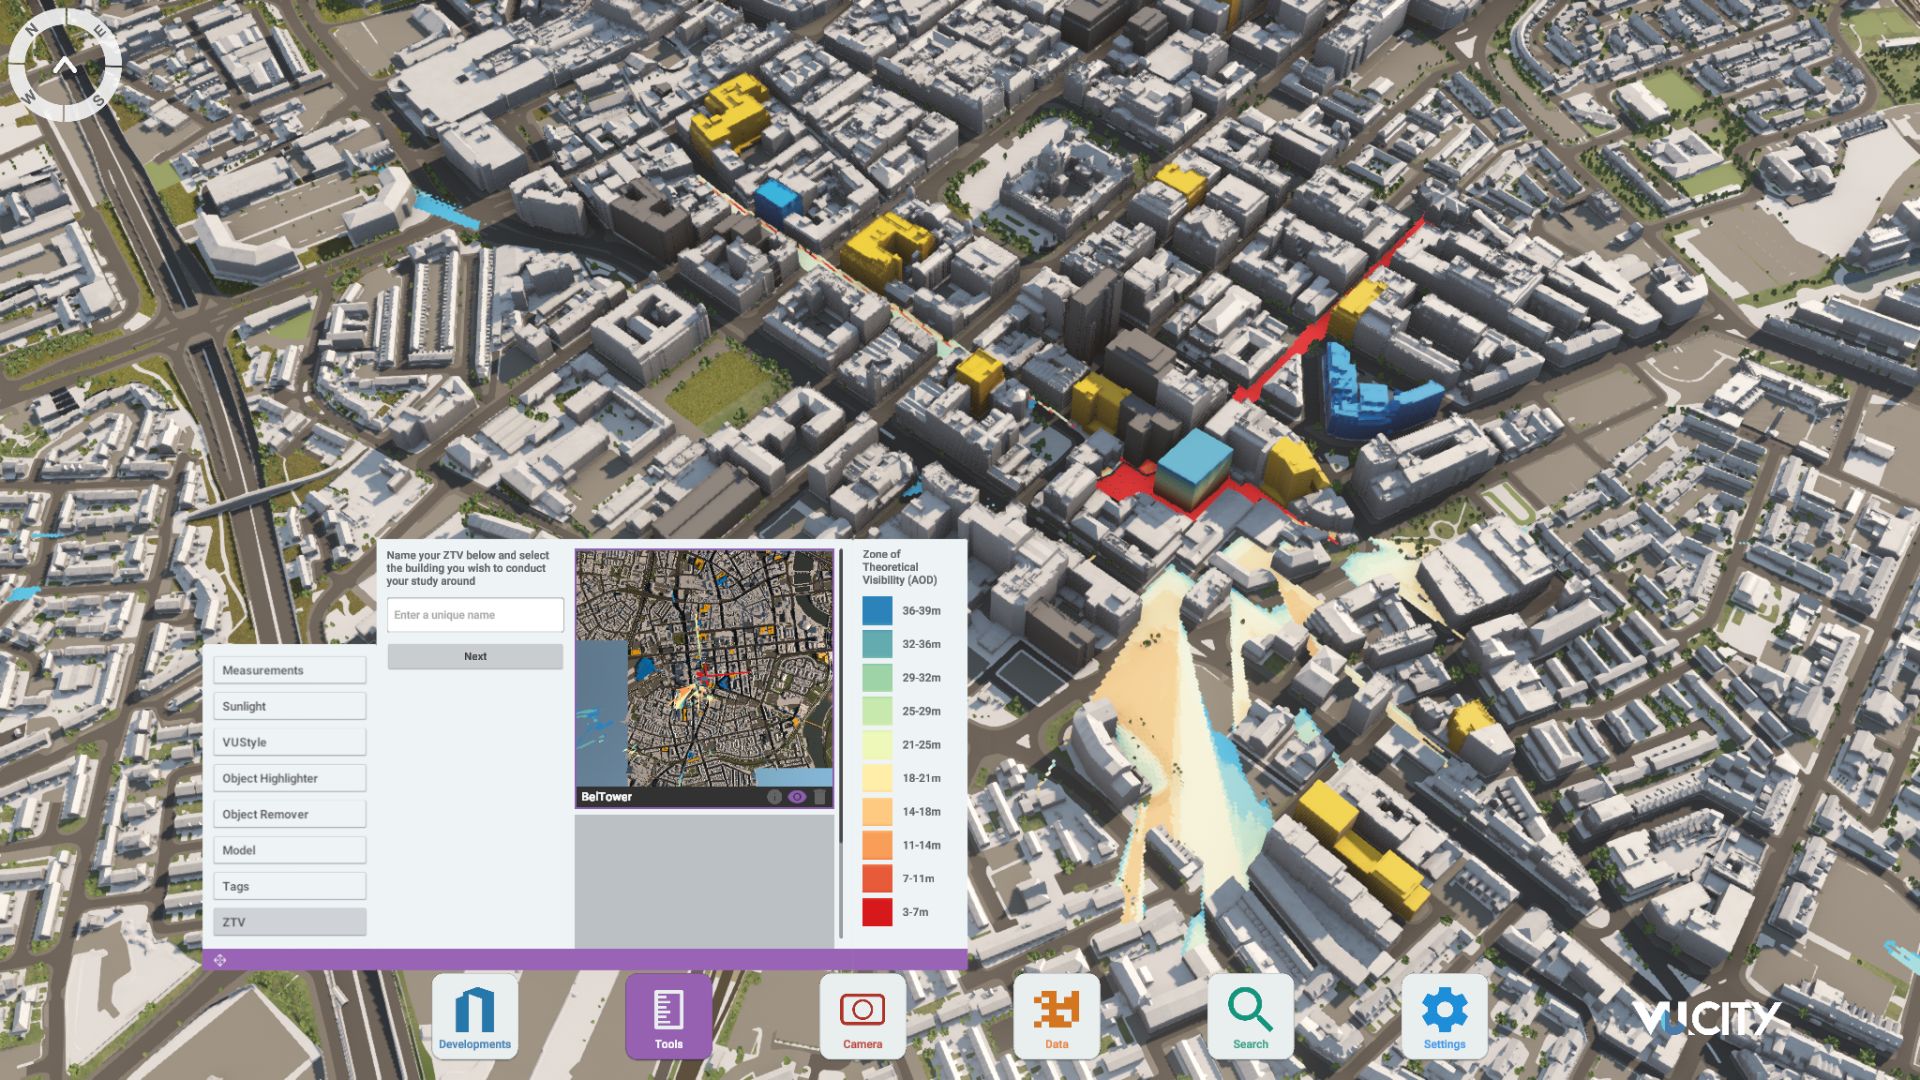
Utilise advanced 3D models and a data-driven approach with our flexible ZTV service.
Bring Your Vision to Life with a 3D Flythrough Video.
26 UK & International Cities
Over 3,000+ sq km accurate to 15cm | Tools to scope, create & collaborate on designs
Shape Tomorrow’s Cities, Today.
Begin Your Free Trial Now.