Explore our Cities
Over 3,000+ sq km accurate to 15cm, with all the tools to scope, create & collaborate.


Project-Ready Services for Every Stage
Go beyond the platform with VU.CITY’s expert support. From custom 3D modelling to advanced visualisation, we help you deliver projects faster and with greater impact.

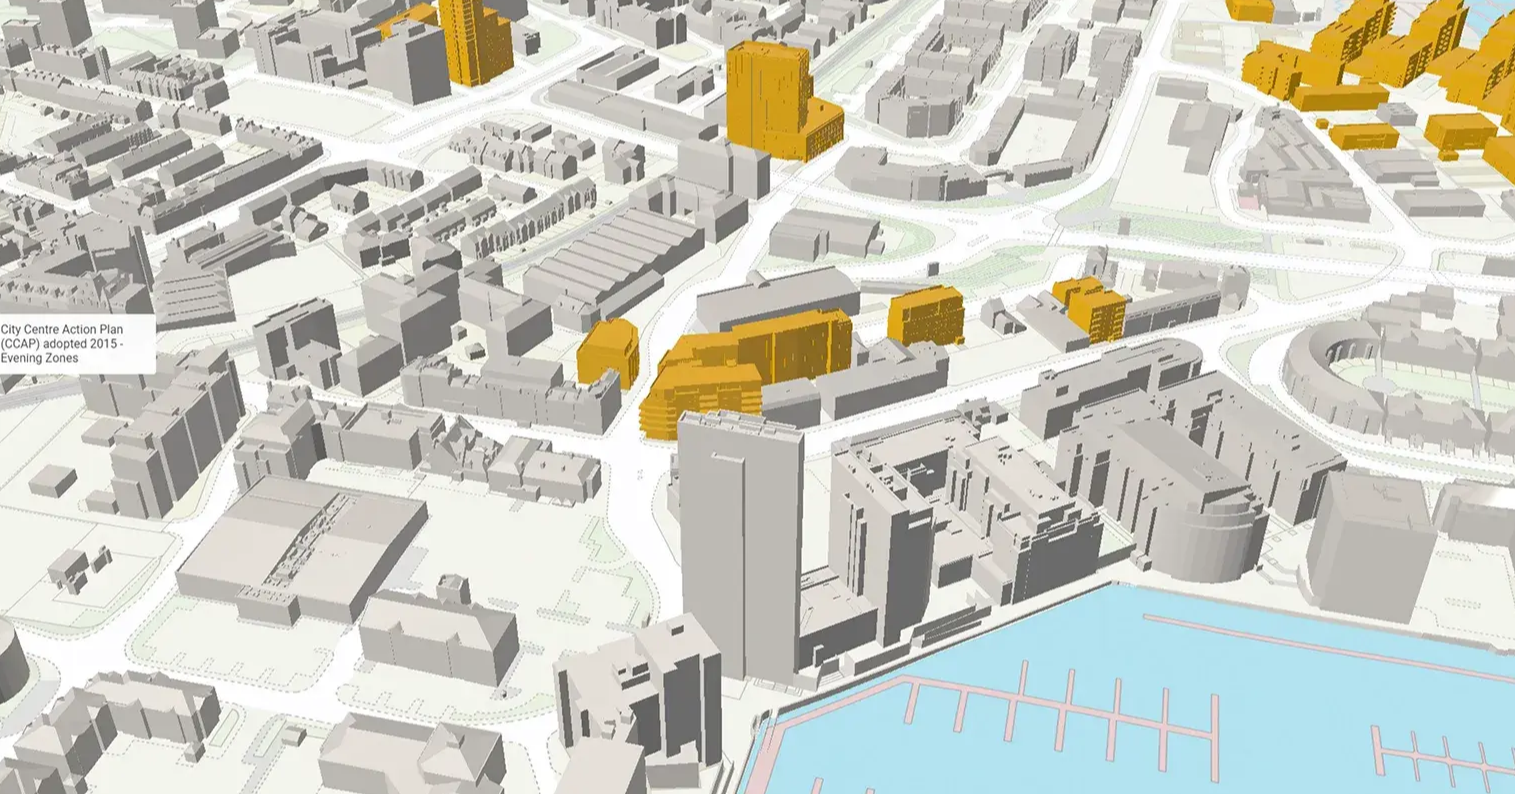
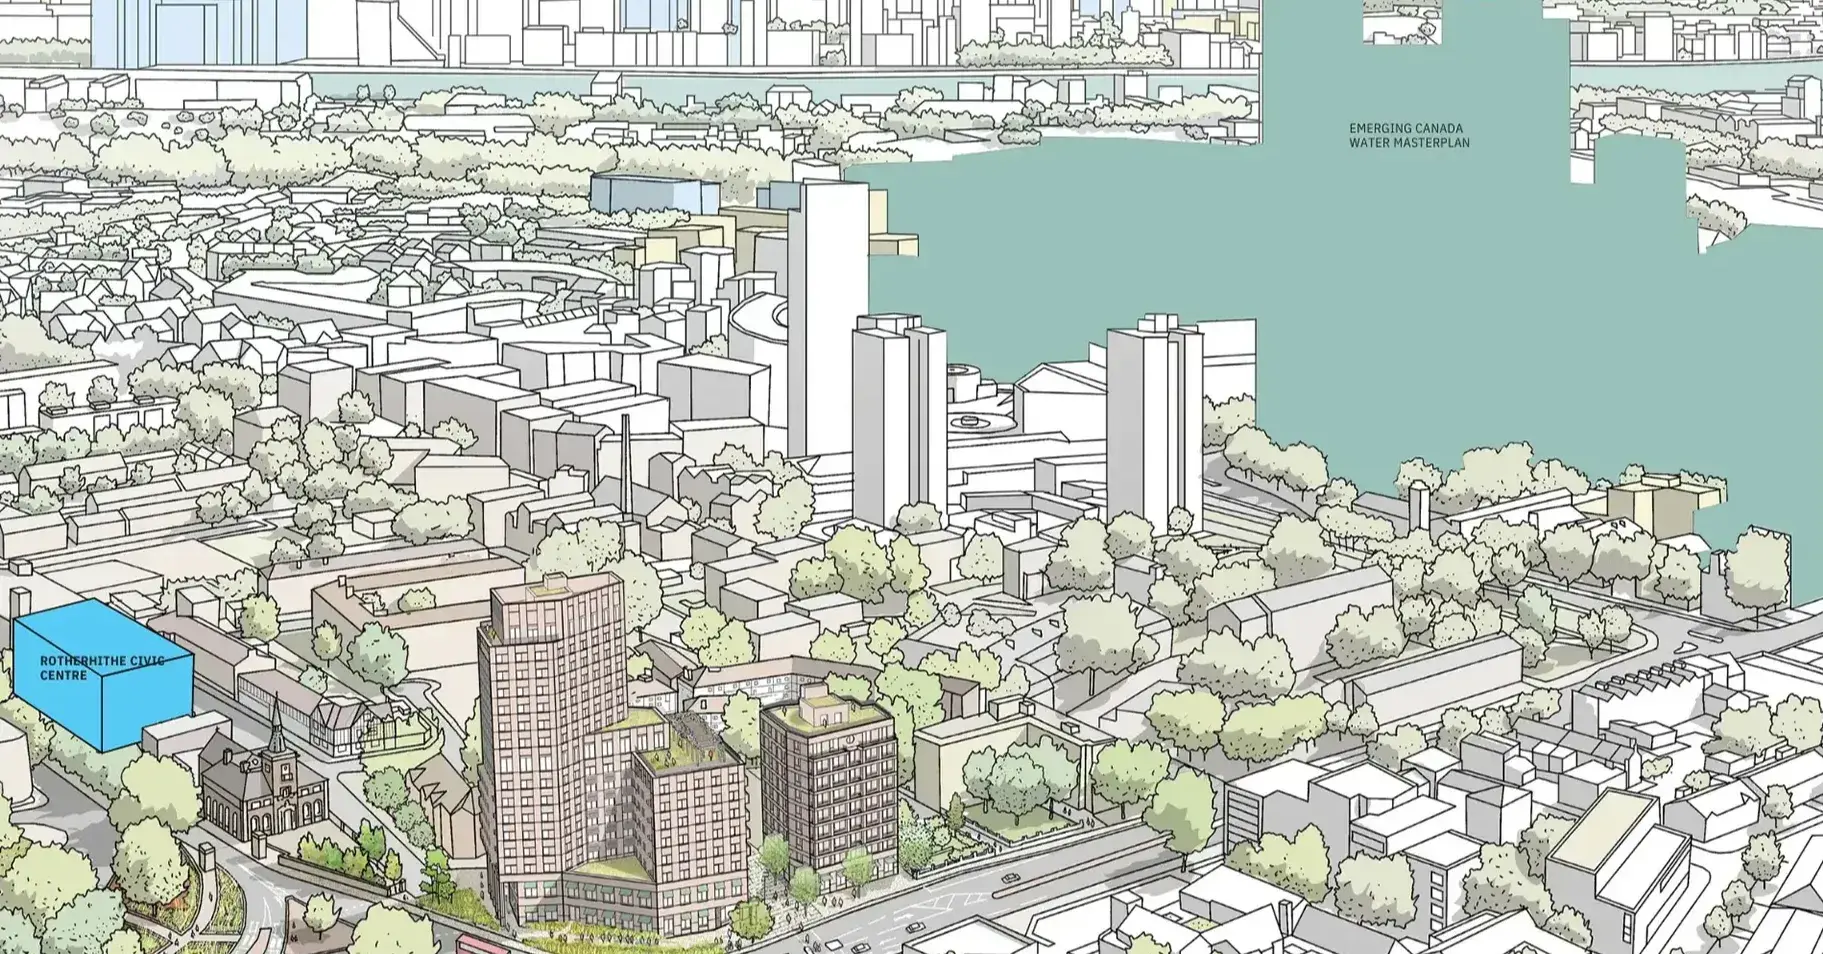
Accurate. Detailed. Ready when you are.
Industry-leading 3D city models built for real-world decision-making and project success.

Your site. Fully loaded and project-ready.
Custom digital models for campuses, masterplans, major developments and more.

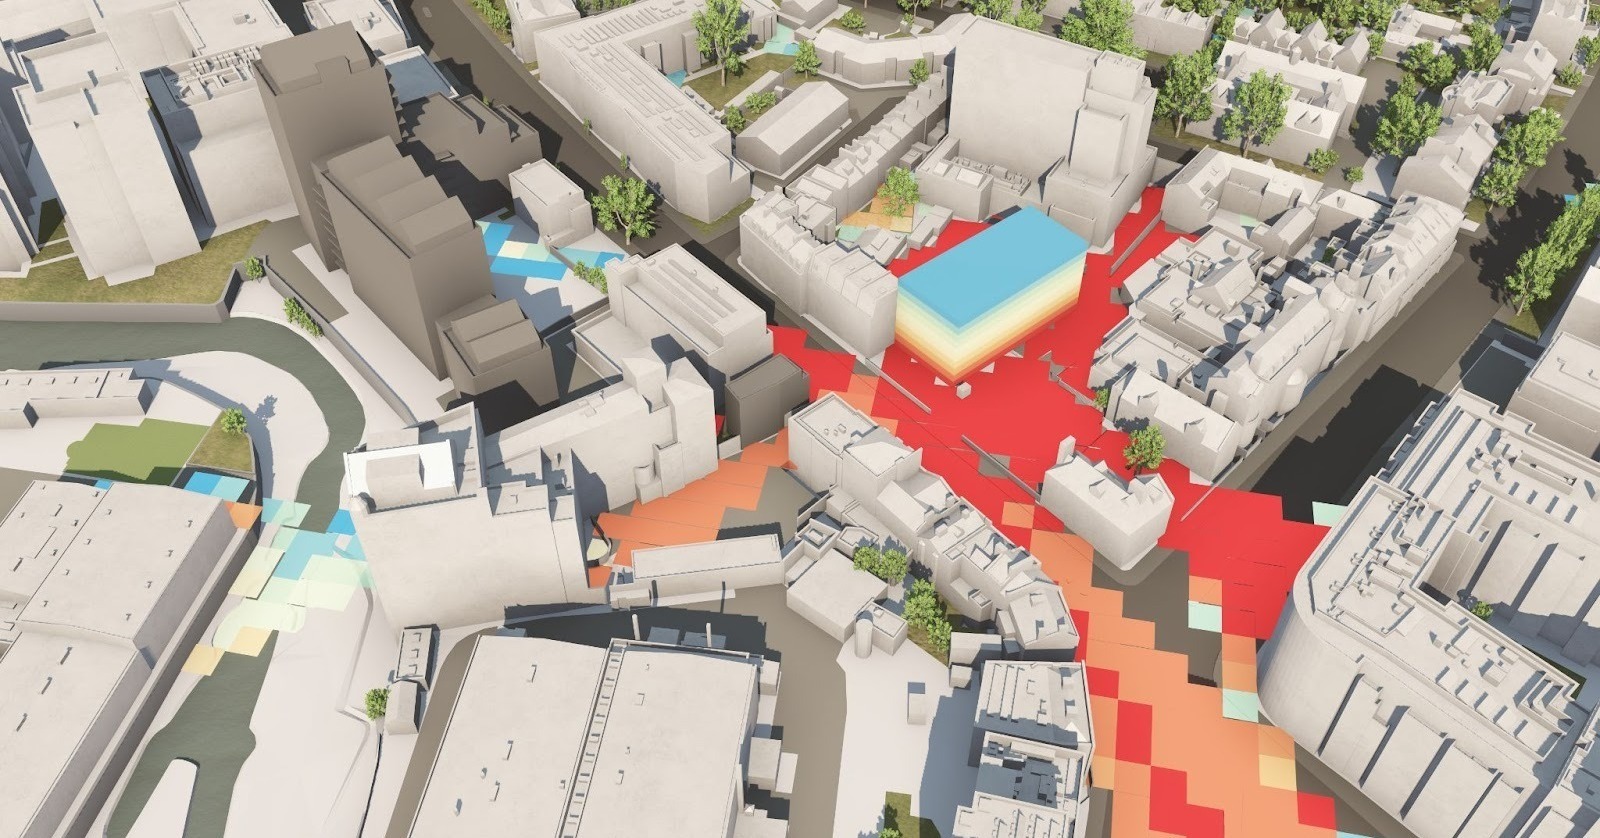
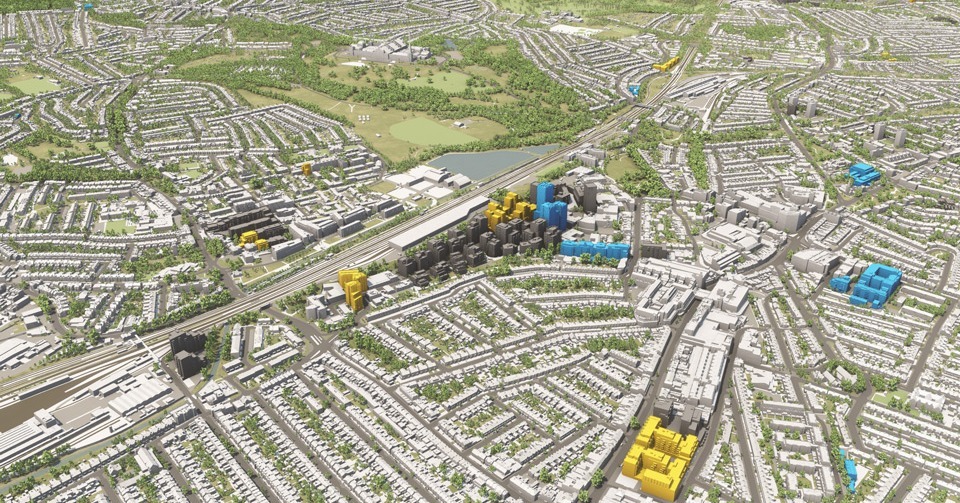
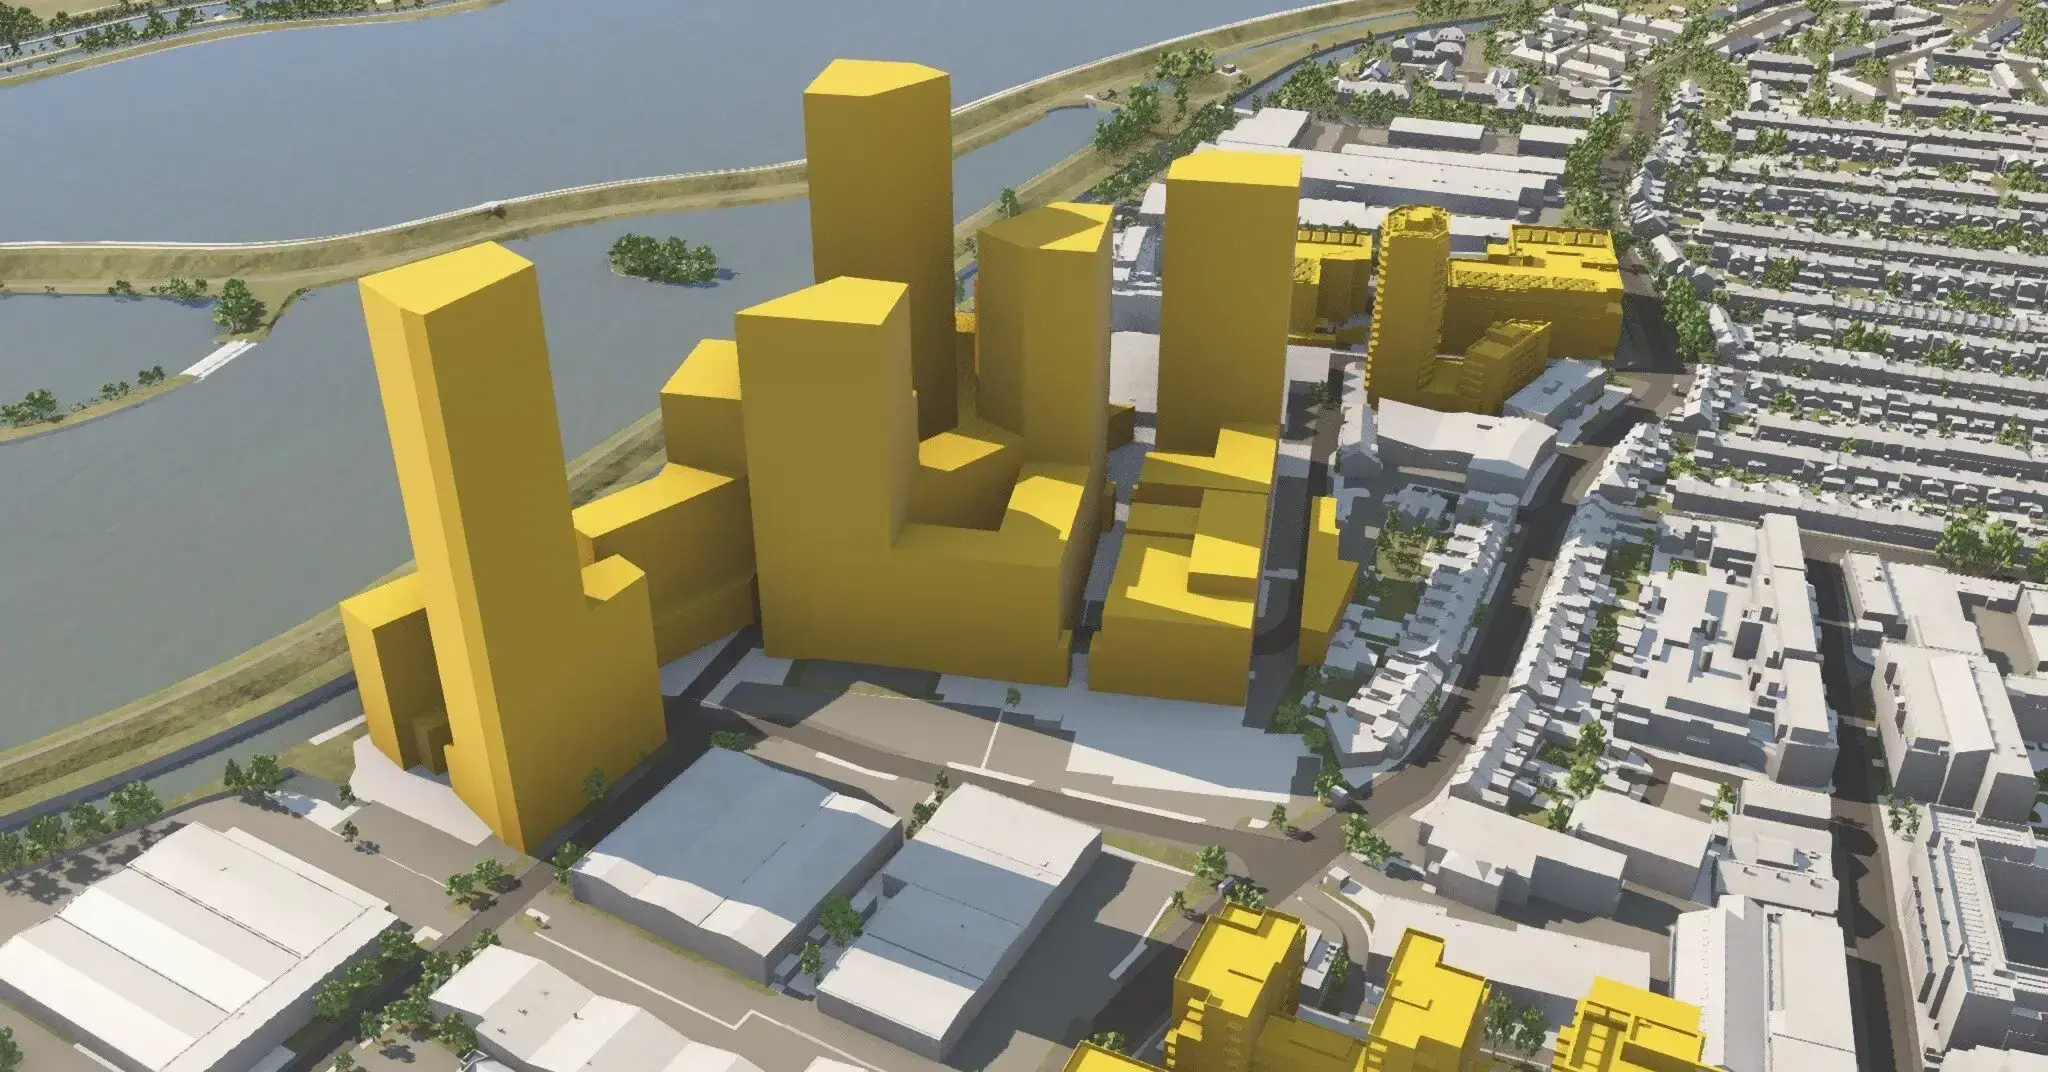
See the complete picture with precision.
Extended range, toggle options and heatmaps for deeper feasibility analysis and sharper planning.

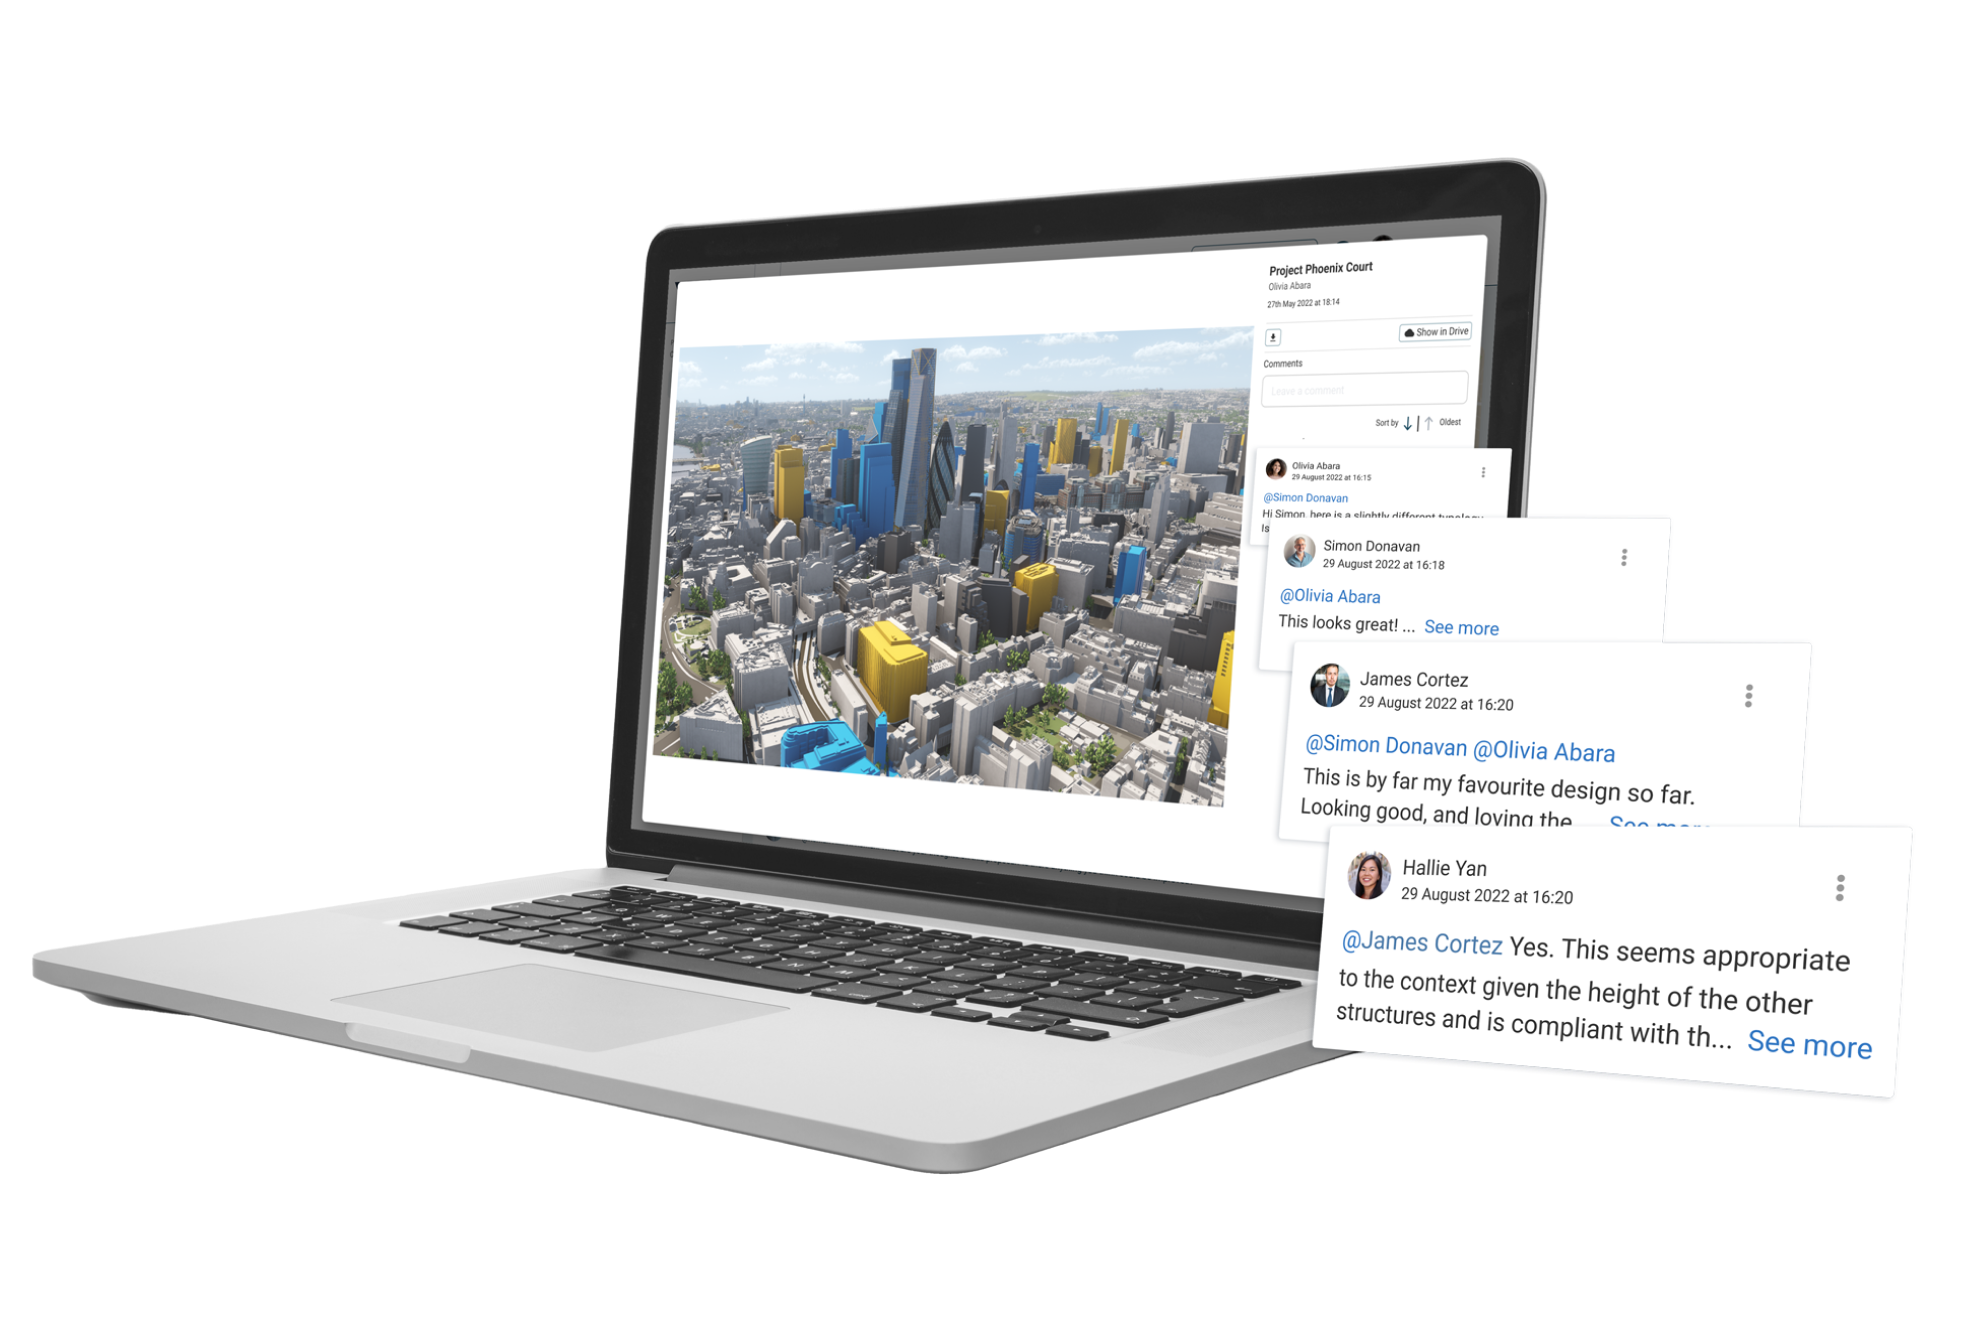
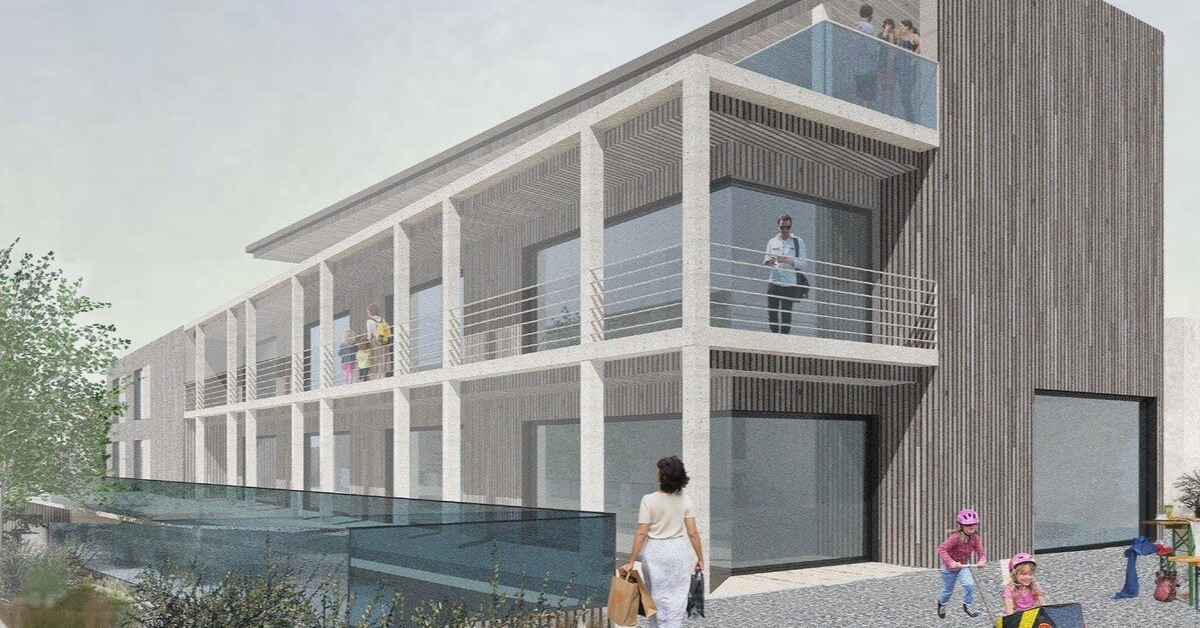
Bring your vision to life in 3D.
Cinematic, high-impact flythroughs that showcase projects and engage stakeholders.
Case Studies
-1-1-1.png)
VU.CITY seamlessly integrates with leading 3D digital software for an easy fit into existing workflows.
We are compatible with the biggest 3D software providers so that you can focus on your designs and plans with minimal disruption.
SiteSolve is our early-stage site exploration and generative design tool. Find out more.

Optimise FBX exports from Revit with our VU.CITY Revit Plugin and Update Agent. Embed materials, maintain positioning, and more.
Export SKP models to FBX using our VU.CITY SketchUp Plugin (beta). Produce FBX files optimised for use in VU.CITY.
Optimise and fix common issues with FBX models using our VU.CITY Blender Add-in. It's the best model editor we've come across.
Shape Tomorrow’s Cities, Today.
Begin Your Free Trial Now.